Kraft 2001 Annual Report Download - page 33
Download and view the complete annual report
Please find page 33 of the 2001 Kraft annual report below. You can navigate through the pages in the report by either clicking on the pages listed below, or by using the keyword search tool below to find specific information within the annual report.-
 1
1 -
2
-
3
-
4
-
5
-
6
-
7
-
8
-
9
-
10
-
11
-
12
-
13
-
14
-
15
-
16
-
17
-
18
-
19
-
20
-
21
-
22
-
 23
23 -
 24
24 -
 25
25 -
 26
26 -
 27
27 -
 28
28 -
 29
29 -
 30
30 -
 31
31 -
 32
32 -
 33
33 -
 34
34 -
 35
35 -
 36
36 -
 37
37 -
 38
38 -
 39
39 -
 40
40 -
 41
41 -
 42
42 -
 43
43 -
44
-
45
-
46
-
47
-
48
-
49
-
50
-
51
-
52
-
53
-
54
-
55
-
56
-
57
-
58
-
59
-
60
-
61
-
62
-
63
-
64
-
65
-
66
 |
 |

Kraft Foods Inc.
27
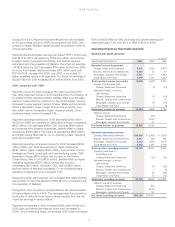
During 2001, the Company’s reported effective tax rate increased
by 4.0 percentage points to 45.4% as compared with 2000, due
primarily to higher Nabisco-related goodwill amortization, which is
not tax deductible.
Reported diluted and basic earnings per share (“EPS”), which were
both $1.17 for 2001, decreased by 15.2% from 2000, due primarily
to higher levels of goodwill amortization and interest expense
associated with the acquisition of Nabisco. Reported net earnings
of $1,882 million for 2001 decreased $119 million (5.9%) from 2000.
On a pro forma basis, diluted and basic EPS, which were both
$1.21 for 2001, increased by 19.8% over 2000, due primarily to
higher operating results in all segments. Pro forma net earnings of
$2,092 million for 2001 increased $347 million (19.9%) from 2000.
2000 compared with 1999
Reported volume for 2000 increased 313 million pounds (2.4%)
over 1999. Reported volume in 2000 benefited from the inclusion of
53 weeks in 2000 operating results, partially offset by a decrease
related to trade inventory reductions in the United States. Volume
increased in every segment except Cheese, Meals and Enhancers,
where a decrease in lower-margin food service products more
than offset volume increases in higher margin products. On an
underlying basis, volume increased 4.1%.
Reported operating revenues for 2000 decreased $265 million
(1.0%) from 1999, due primarily to unfavorable currency movements
($857 million), the estimated shift in CDC revenues ($194 million)
and revenues from divested businesses, partially offset by higher
volume/mix ($756 million), the impact of acquisitions ($148 million)
and higher pricing ($49 million). On an underlying basis, operating
revenues increased 0.5%.
Reported operating companies income for 2000 increased $502
million (11.8%) over 1999, due primarily to higher volume/mix
($387 million), higher margins ($402 million, due primarily to price
increases and lower commodity and manufacturing costs), 1999
separation charges ($157 million) and the gain on the French
Confectionery Sale in 2000 ($139 million), partially offset by higher
marketing expenses ($366 million), unfavorable currency
movements ($91 million), the shift in CDC income ($80 million)
and the impact of divested businesses. On an underlying basis,
operating companies income increased 7.2%.
Interest and other debt expense, net, increased $58 million (10.8%),
due primarily to the notes issued to Philip Morris in connection with
the acquisition of Nabisco.
During 2000, the Company’s reported effective tax rate decreased
0.9 percentage points to 41.4%. This decrease was due primarily to
a reduction in state and local income taxes resulting from the mix
of pre-tax earnings in various states.
Reported net earnings in 2000 increased $248 million (14.1%) and
2000 basic and diluted earnings per share each increased by
15.0%. On an underlying basis, net earnings of $1.9 billion increased
6.6% over $1.8 billion in 1999, and basic and diluted earnings per
share each grew 7.2% from $1.25 in 1999 to $1.34 in 2000.
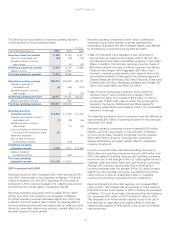
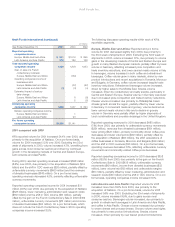
Operating Results by Reportable Segment
Kraft Foods North America
(in millions)
Year Ended December 31, 2001 2000 1999
Reported volume (in pounds):
Cheese, Meals and Enhancers 5,219 4,820 4,874
Biscuits, Snacks and Confectionery 2,350 54 47
Beverages, Desserts and Cereals 3,421 3,117 2,883
Oscar Mayer and Pizza 1,519 1,507 1,433
Total reported volume (in pounds) 12,509 9,498 9,237
Volume of businesses sold:
Cheese, Meals and Enhancers (5) (13)
Estimated impact of century
date change:
Cheese, Meals and Enhancers 16 (16)
Biscuits, Snacks and Confectionery 1(1)
Beverages, Desserts and Cereals 19 (19)
Oscar Mayer and Pizza 5(5)
Underlying volume (in pounds) 12,509 9,534 9,183
Nabisco volume:
Cheese, Meals and Enhancers 418
Biscuits, Snacks and Confectionery 2,260
Beverages, Desserts and Cereals 41
Pro forma volume (in pounds) 12,509 12,253
Reported operating revenues:
Cheese, Meals and Enhancers $10,256 $ 9,405 $ 9,360
Biscuits, Snacks and Confectionery 5,917 329 265
Beverages, Desserts and Cereals 5,370 5,266 5,074
Oscar Mayer and Pizza 3,563 3,461 3,198
Total reported operating revenues 25,106 18,461 17,897
Operating revenues of
businesses sold:
Cheese, Meals and Enhancers (10) (25)
Estimated impact of century
date change:
Cheese, Meals and Enhancers 34 (34)
Biscuits, Snacks and Confectionery 3(3)
Beverages, Desserts and Cereals 22 (22)
Oscar Mayer and Pizza 12 (12)
Underlying operating revenues 25,106 18,522 $17,801
Nabisco operating revenues:
Cheese, Meals and Enhancers 843
Biscuits, Snacks and Confectionery 5,429
Beverages, Desserts and Cereals 107
Pro forma operating revenues $25,106 $24,901