JetBlue Airlines 2010 Annual Report Download - page 87
Download and view the complete annual report
Please find page 87 of the 2010 JetBlue Airlines annual report below. You can navigate through the pages in the report by either clicking on the pages listed below, or by using the keyword search tool below to find specific information within the annual report.-
 1
1 -
2
-
3
-
4
-
5
-
6
-
7
-
8
-
9
-
10
-
11
-
12
-
13
-
14
-
15
-
16
-
17
-
18
-
19
-
20
-
21
-
22
-
23
-
24
-
25
-
26
-
27
-
28
-
29
-
30
-
31
-
32
-
33
-
34
-
35
-
36
-
37
-
38
-
39
-
40
-
41
-
42
-
43
-
44
-
45
-
46
-
47
-
48
-
49
-
50
-
51
-
52
-
53
-
54
-
55
-
56
-
57
-
58
-
59
-
60
-
61
-
62
-
63
-
64
-
65
-
66
-
67
-
68
-
69
-
70
-
71
-
72
-
73
-
74
-
75
-
76
-
 77
77 -
 78
78 -
 79
79 -
 80
80 -
 81
81 -
 82
82 -
 83
83 -
 84
84 -
 85
85 -
 86
86 -
 87
87 -
 88
88 -
 89
89 -
 90
90 -
 91
91 -
 92
92 -
 93
93 -
 94
94 -
 95
95 -
 96
96 -
 97
97 -
98
-
99
-
100
-
101
-
102
-
103
-
104
-
105
-
106
-
107
-
108
-
109
-
110
-
111
-
112
-
113
-
114
-
115
-
116
-
117
-
118
-
119
-
120
-
121
-
122
 |
 |

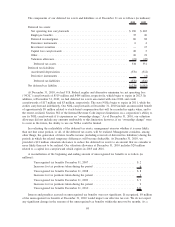
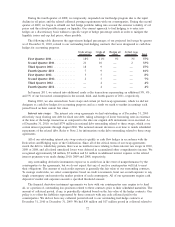
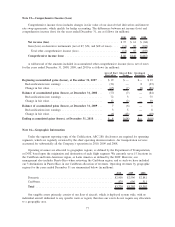
Note 17—Quarterly Financial Data (Unaudited)
Quarterly results of operations for the years ended December 31 are summarized below (in millions,
except per share amounts):
First
Quarter
Second
Quarter
Third
Quarter
Fourth
Quarter
2010 (1)
Operating revenues ...................................... $871 $940 $1,030 $ 938
Operating income ....................................... 43 95 140 55
Net income (loss) ....................................... (1) 31 59 8
Basic earnings (loss) per share .............................. $ — $0.11 $ 0.21 $0.03
Diluted earnings (loss) per share ............................ $ — $0.10 $ 0.18 $0.03
2009 (2)
Operating revenues ...................................... $795 $808 $ 856 $833
Operating income ....................................... 75 77 68 65
Net income ............................................ 13 21 16 11
Basic earnings per share .................................. $0.05 $0.08 $ 0.06 $0.04
Diluted earnings per share ................................. $0.05 $0.07 $ 0.05 $0.04
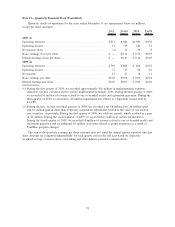
(1) During the first quarter of 2010, we recorded approximately $16 million in implementation expenses
related to our new customer service system implemented in January 2010. During the first quarter of 2010,
we recorded $4 million of revenue related to our co-branded credit card agreement guarantee. During the
third quarter of 2010, we recorded a $6 million impairment loss related to a Spectrum license held by
LiveTV.
(2) During the first, second, and third quarters of 2009, we recorded a net $8 million loss, $6 million gain,
and $3 million gain in other-than temporary impairment adjustments related to the value of our auction
rate securities, respectively. During the first quarter of 2009, we sold two aircraft, which resulted in a gain
of $1 million. During the second quarter of 2009, we recorded $11 million in certain tax incentives.
During the fourth quarter of 2009, we recorded $5 million of revenue related to our co-branded credit card
agreement guarantee and an additional $5 million in revenue related to points expiration as a result of
TrueBlue program changes.
The sum of the quarterly earnings per share amounts does not equal the annual amount reported since per
share amounts are computed independently for each quarter and for the full year based on respective
weighted-average common shares outstanding and other dilutive potential common shares.
78