JetBlue Airlines 2010 Annual Report Download - page 81
Download and view the complete annual report
Please find page 81 of the 2010 JetBlue Airlines annual report below. You can navigate through the pages in the report by either clicking on the pages listed below, or by using the keyword search tool below to find specific information within the annual report.-
 1
1 -
2
-
3
-
4
-
5
-
6
-
7
-
8
-
9
-
10
-
11
-
12
-
13
-
14
-
15
-
16
-
17
-
18
-
19
-
20
-
21
-
22
-
23
-
24
-
25
-
26
-
27
-
28
-
29
-
30
-
31
-
32
-
33
-
34
-
35
-
36
-
37
-
38
-
39
-
40
-
41
-
42
-
43
-
44
-
45
-
46
-
47
-
48
-
49
-
50
-
51
-
52
-
53
-
54
-
55
-
56
-
57
-
58
-
59
-
60
-
61
-
62
-
63
-
64
-
65
-
66
-
67
-
68
-
69
-
70
-
 71
71 -
 72
72 -
 73
73 -
 74
74 -
 75
75 -
 76
76 -
 77
77 -
 78
78 -
 79
79 -
 80
80 -
 81
81 -
 82
82 -
 83
83 -
 84
84 -
 85
85 -
 86
86 -
 87
87 -
 88
88 -
 89
89 -
 90
90 -
 91
91 -
92
-
93
-
94
-
95
-
96
-
97
-
98
-
99
-
100
-
101
-
102
-
103
-
104
-
105
-
106
-
107
-
108
-
109
-
110
-
111
-
112
-
113
-
114
-
115
-
116
-
117
-
118
-
119
-
120
-
121
-
122
 |
 |

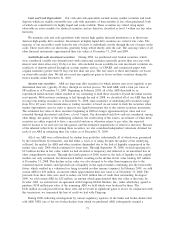
During the fourth quarter of 2008, we temporarily suspended our fuel hedge program due to the rapid
decline in oil prices and the related collateral posting requirements with our counterparties. During the second
quarter of 2009, we began to rebuild our fuel hedge portfolio taking into account the extreme volatility of oil
prices and the related possible impact on liquidity. Our current approach to fuel hedging is to enter into
hedges on a discretionary basis without a specific target of hedge percentage needs in order to mitigate the
liquidity issues and cap fuel prices, when possible.
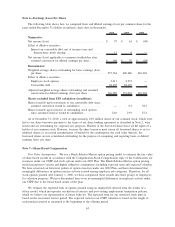
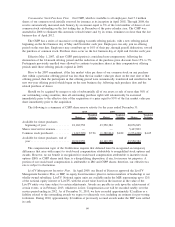
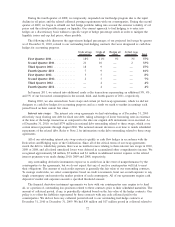
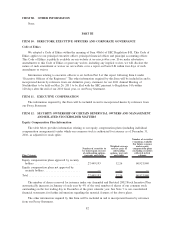
The following table illustrates the approximate hedged percentages of our projected fuel usage by quarter
as of December 31, 2010, related to our outstanding fuel hedging contracts that were designated as cash flow
hedges for accounting purposes.
Crude oil cap
agreements
Crude oil
collars
Heating oil
collars
Jet fuel swap
agreements Total
First Quarter 2011 ............... 18% 11% 5% 3% 37%
Second Quarter 2011 ............. 21 10 — 2 33%
Third Quarter 2011 .............. 18 9 — — 27%
Fourth Quarter 2011 ............. 7 9 — — 16%
First Quarter 2012 ............... 3 5 — — 8%
Second Quarter 2012 ............. 2 5 — — 7%
Third Quarter 2012 .............. — 4 — — 4%
Fourth Quarter 2012 ............. — 4 — — 4%
In January 2011, we entered into additional crude collar transactions representing an additional 5%, 4%,
and 5% of our forecasted consumption in the second, third, and fourth quarter of 2011, respectively.
During 2010, we also entered into basis swaps and certain jet fuel swap agreements, which we did not
designate as cash flow hedges for accounting purposes and as a result we mark to market in earnings each
period based on their current fair value.
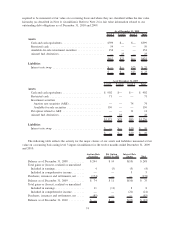
Interest rate swaps: The interest rate swap agreements we had outstanding as of December 31, 2010
effectively swap floating rate debt for fixed rate debt, taking advantage of lower borrowing rates in existence
at the time of the hedge transaction as compared to the date our original debt instruments were executed. As
of December 31, 2010, we had $379 million in notional debt outstanding related to these swaps, which cover
certain interest payments through August 2016. The notional amount decreases over time to match scheduled
repayments of the related debt. Refer to Note 2 for information on the debt outstanding related to these swap
agreements.
All of our outstanding interest rate swap contracts qualify as cash flow hedges in accordance with the
Derivatives and Hedging topic of the Codification. Since all of the critical terms of our swap agreements
match the debt to which they pertain, there was no ineffectiveness relating to these interest rate swaps in 2010,
2009 or 2008, and all related unrealized losses were deferred in accumulated other comprehensive income. We
recognized approximately $8 million, $5 million and $1 million in additional interest expense as the related
interest payments were made during 2010, 2009 and 2008, respectively.
Any outstanding derivative instruments expose us to credit loss in the event of nonperformance by the
counterparties to the agreements, but we do not expect that any of our five counterparties will fail to meet
their obligations. The amount of such credit exposure is generally the fair value of our outstanding contracts.
To manage credit risks, we select counterparties based on credit assessments, limit our overall exposure to any
single counterparty and monitor the market position of each counterparty. All of our agreements require cash
deposits if market risk exposure exceeds a specified threshold amount.
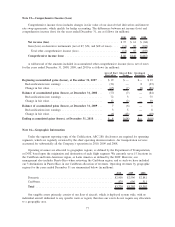
The financial derivative instrument agreements we have with our counterparties may require us to fund
all, or a portion of, outstanding loss positions related to these contracts prior to their scheduled maturities. The
amount of collateral posted, if any, is periodically adjusted based on the fair value of the hedge contracts. Our
policy is to offset the liabilities represented by these contracts with any cash collateral paid to the
counterparties. We did not have any collateral posted related to our outstanding fuel hedge contracts at
December 31, 2010 or December 31, 2009. We had $30 million and $17 million posted in collateral related to
72