JetBlue Airlines 2010 Annual Report Download - page 73
Download and view the complete annual report
Please find page 73 of the 2010 JetBlue Airlines annual report below. You can navigate through the pages in the report by either clicking on the pages listed below, or by using the keyword search tool below to find specific information within the annual report.-
 1
1 -
2
-
3
-
4
-
5
-
6
-
7
-
8
-
9
-
10
-
11
-
12
-
13
-
14
-
15
-
16
-
17
-
18
-
19
-
20
-
21
-
22
-
23
-
24
-
25
-
26
-
27
-
28
-
29
-
30
-
31
-
32
-
33
-
34
-
35
-
36
-
37
-
38
-
39
-
40
-
41
-
42
-
43
-
44
-
45
-
46
-
47
-
48
-
49
-
50
-
51
-
52
-
53
-
54
-
55
-
56
-
57
-
58
-
59
-
60
-
61
-
62
-
 63
63 -
 64
64 -
 65
65 -
 66
66 -
 67
67 -
 68
68 -
 69
69 -
 70
70 -
 71
71 -
 72
72 -
 73
73 -
 74
74 -
 75
75 -
 76
76 -
 77
77 -
 78
78 -
 79
79 -
 80
80 -
 81
81 -
 82
82 -
 83
83 -
84
-
85
-
86
-
87
-
88
-
89
-
90
-
91
-
92
-
93
-
94
-
95
-
96
-
97
-
98
-
99
-
100
-
101
-
102
-
103
-
104
-
105
-
106
-
107
-
108
-
109
-
110
-
111
-
112
-
113
-
114
-
115
-
116
-
117
-
118
-
119
-
120
-
121
-
122
 |
 |

We estimate the expected volatility of our common stock at the grant date using a blend of 75% historical
volatility of our common stock and 25% implied volatility of two-year publicly traded options on our common
stock as of the option grant date. Our decision to use a blend of historical and implied volatility was based
upon the volume of actively traded options on our common stock and our belief that historical volatility alone
may not be completely representative of future stock price trends.
Our risk-free interest rate assumption is determined using the Federal Reserve nominal rates for
U.S. Treasury zero-coupon bonds with maturities similar to those of the expected term of the award being
valued. We have never paid any cash dividends on our common stock and we do not anticipate paying any
cash dividends in the foreseeable future. Therefore, we assumed an expected dividend yield of zero.
Additionally, the Compensation topic of the Codification requires us to estimate pre-vesting forfeitures at
the time of grant and periodically revise those estimates in subsequent periods if actual forfeitures differ from
those estimates. We record stock-based compensation expense only for those awards expected to vest using an
estimated forfeiture rate based on our historical pre-vesting forfeiture data.
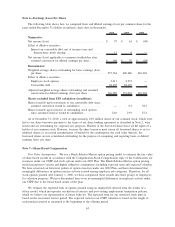
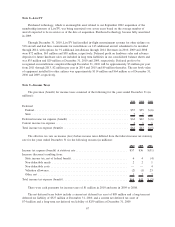
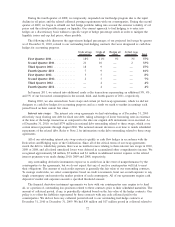
The following table shows our assumptions used to compute the stock-based compensation expense for
stock option grants for the year ended December 31, 2008. We did not grant any stock options in 2009 or
2010.
2008
Expected term (years) . . ................................................... 6.0
Volatility ............................................................... 47.7%
Risk-free interest rate . . . ................................................... 3.0%
Weighted average fair value of stock options .................................... $3.45
Unrecognized stock-based compensation expense was approximately $14 million as of December 31,
2010, relating to a total of 3.7 million unvested restricted stock units and 1.1 million unvested stock options
under our 2002 Plan. We expect to recognize this stock-based compensation expense over a weighted average
period of approximately two years. The total fair value of stock options vested during the year was
approximately $9 million in each of the years ended December 31, 2010, 2009 and 2008.
Stock Incentive Plan: The 2002 Plan, which includes stock options issued during 1999 through 2001
under a previous plan as well as all options issued since, provides for incentive and non-qualified stock
options and restricted stock units to be granted to certain employees and members of our Board of Directors,
as well as deferred stock units to be granted to members of our Board of Directors. The 2002 Plan became
effective following our initial public offering in April 2002.
During 2007, we began issuing restricted stock units under the 2002 Plan. These awards vest in annual
installments over three years or could be accelerated upon the occurrence of a change in control as defined in
the 2002 Plan. Our policy is to grant restricted stock units based on the market price of the underlying
common stock on the date of grant.
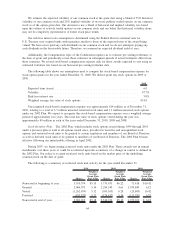
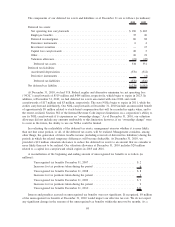
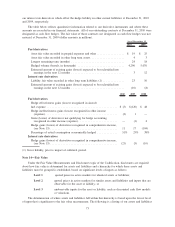
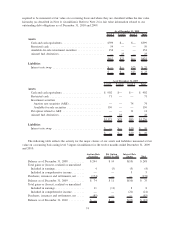
The following is a summary of restricted stock unit activity for the year ended December 31:
Shares
Weighted
Average
Grant Date
Fair Value Shares
Weighted
Average
Grant Date
Fair Value Shares
Weighted
Average
Grant Date
Fair Value
2010 2009 2008
Nonvested at beginning of year ....... 3,310,374 $5.13 1,735,671 $6.22 71,418 $10.42
Granted ........................ 2,086,973 5.36 2,294,240 4.61 1,799,849 6.12
Vested . ........................ (1,262,459) 5.32 (595,105) 6.28 (23,805) 10.42
Forfeited........................ (453,875) 5.21 (124,432) 5.36 (111,791) 6.35
Nonvested at end of year ............ 3,681,013 $5.18 3,310,374 $5.13 1,735,671 $ 6.22
64