JetBlue Airlines 2010 Annual Report Download - page 42
Download and view the complete annual report
Please find page 42 of the 2010 JetBlue Airlines annual report below. You can navigate through the pages in the report by either clicking on the pages listed below, or by using the keyword search tool below to find specific information within the annual report.-
 1
1 -
2
-
3
-
4
-
5
-
6
-
7
-
8
-
9
-
10
-
11
-
12
-
13
-
14
-
15
-
16
-
17
-
18
-
19
-
20
-
21
-
22
-
23
-
24
-
25
-
26
-
27
-
28
-
29
-
30
-
31
-
 32
32 -
 33
33 -
 34
34 -
 35
35 -
 36
36 -
 37
37 -
 38
38 -
 39
39 -
 40
40 -
 41
41 -
 42
42 -
 43
43 -
 44
44 -
 45
45 -
 46
46 -
 47
47 -
 48
48 -
 49
49 -
 50
50 -
 51
51 -
 52
52 -
53
-
54
-
55
-
56
-
57
-
58
-
59
-
60
-
61
-
62
-
63
-
64
-
65
-
66
-
67
-
68
-
69
-
70
-
71
-
72
-
73
-
74
-
75
-
76
-
77
-
78
-
79
-
80
-
81
-
82
-
83
-
84
-
85
-
86
-
87
-
88
-
89
-
90
-
91
-
92
-
93
-
94
-
95
-
96
-
97
-
98
-
99
-
100
-
101
-
102
-
103
-
104
-
105
-
106
-
107
-
108
-
109
-
110
-
111
-
112
-
113
-
114
-
115
-
116
-
117
-
118
-
119
-
120
-
121
-
122
 |
 |

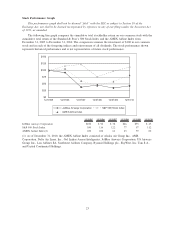
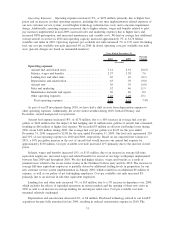
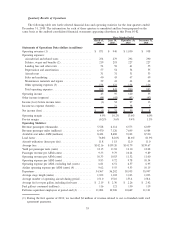
Operating Revenues. Operating revenues decreased 3%, or $100 million, primarily due to a 4% decrease
in passenger revenues. The $126 million decrease in passenger revenues was attributable to a 4% decrease in
yield over 2008 and a 0.7 point decrease in load factor on relatively flat capacity, offset by increases in fees
from our Even More Legroom optional upgrade product, which we introduced in mid-2008.
Other revenues increased 8%, or $26 million, primarily due to higher excess baggage revenue of
$18 million resulting from the introduction of the second checked bag fee in June 2008 and increased rates for
these and other ancillary services during 2009. Other revenue also increased due to additional LiveTV third-
party revenues as a result of additional third party aircraft installations, and higher concession revenues from
our new terminal at JFK, partially offset by a reduction in charter revenue.
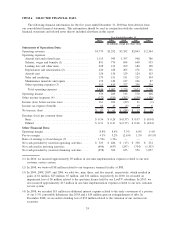
Operating Expenses. Operating expenses decreased 8%, or $272 million, primarily due to lower fuel
prices, partially offset by increased salaries, wages and benefits, depreciation and amortization, maintenance
and variable costs. In 2009, operating expenses were offset by $1 million in gains on the sale of aircraft
compared to $23 million in gains on the sale of aircraft in 2008. While we had on average eight additional
average aircraft in service in 2009, operating capacity increased less than 1% to 32.56 billion available seat
miles in 2009 due to shorter stage lengths as a result of shifting capacity from transcontinental flying to
shorter haul. Operating expenses per available seat mile decreased 9% to 9.24 cents. Excluding fuel, our cost
per available seat mile increased 9% in 2009. In detail, operating costs per available seat mile were (percent
changes are based on unrounded numbers):
2009 2008
Percent
Change
Year Ended December 31,
(in cents)
Operating expenses:
Aircraft fuel and related taxes ...................... 2.91 4.31 (32.6)%
Salaries, wages and benefits ....................... 2.38 2.14 11.4
Landing fees and other rents ....................... .65 .62 6.4
Depreciation and amortization ...................... .70 .63 11.0
Aircraft rent ................................... .39 .40 (2.5)
Sales and marketing ............................. .46 .47 (0.8)
Maintenance materials and repairs ................... .46 .39 17.2
Other operating expenses.......................... 1.29 1.15 10.7
Total operating expenses ........................ 9.24 10.11 (8.6)%
In 2009, our average aircraft utilization declined 5% to 11.5 hours per day. A lower aircraft utilization
results in fewer available seat miles and, therefore, higher unit costs. We estimate that a significant portion of
the year-over-year increase in our total cost per available seat mile, excluding fuel, was attributable to the
decrease in our aircraft utilization and also was a significant factor of the increase in each component.
Aircraft fuel expense decreased 32%, or $452 million, due to a 33% decrease in average fuel cost per
gallon, or $457 million after the impact of fuel hedging, offset by two million more gallons of aircraft fuel
consumed, resulting in $6 million of higher fuel expense. We recorded $120 million in fuel hedge losses
during 2009 versus $47 million in fuel hedge gains during 2008. Our average fuel cost per gallon was $2.08
for the year ended December 31, 2009 compared to $3.08 for the year ended December 31, 2008. Our fuel
costs represented 31% and 43% of our operating expenses in 2009 and 2008, respectively. Cost per available
seat mile decreased 33% primarily due to the decrease in fuel prices.
Salaries, wages and benefits increased 12%, or $82 million, due primarily to increases in pilot pay and
related benefits and a 5% increase in average full-time equivalent employees. The increase in average full-time
equivalent employees was partially driven by our policy of not furloughing employees and additional staffing
levels in preparation for our new customer service system implementation in January 2010. Cost per available
seat mile increased 11% primarily due to increased average wages.
Landing fees and other rents increased 7%, or $14 million, due to a 5% increase in departures over 2008,
and increased landing fees associated with increased rates in existing markets as well as the opening of eight
33