JetBlue Airlines 2010 Annual Report Download - page 86
Download and view the complete annual report
Please find page 86 of the 2010 JetBlue Airlines annual report below. You can navigate through the pages in the report by either clicking on the pages listed below, or by using the keyword search tool below to find specific information within the annual report.-
 1
1 -
2
-
3
-
4
-
5
-
6
-
7
-
8
-
9
-
10
-
11
-
12
-
13
-
14
-
15
-
16
-
17
-
18
-
19
-
20
-
21
-
22
-
23
-
24
-
25
-
26
-
27
-
28
-
29
-
30
-
31
-
32
-
33
-
34
-
35
-
36
-
37
-
38
-
39
-
40
-
41
-
42
-
43
-
44
-
45
-
46
-
47
-
48
-
49
-
50
-
51
-
52
-
53
-
54
-
55
-
56
-
57
-
58
-
59
-
60
-
61
-
62
-
63
-
64
-
65
-
66
-
67
-
68
-
69
-
70
-
71
-
72
-
73
-
74
-
75
-
 76
76 -
 77
77 -
 78
78 -
 79
79 -
 80
80 -
 81
81 -
 82
82 -
 83
83 -
 84
84 -
 85
85 -
 86
86 -
 87
87 -
 88
88 -
 89
89 -
 90
90 -
 91
91 -
 92
92 -
 93
93 -
 94
94 -
 95
95 -
 96
96 -
97
-
98
-
99
-
100
-
101
-
102
-
103
-
104
-
105
-
106
-
107
-
108
-
109
-
110
-
111
-
112
-
113
-
114
-
115
-
116
-
117
-
118
-
119
-
120
-
121
-
122
 |
 |

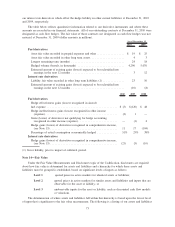
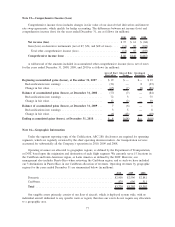
Note 15—Comprehensive Income (Loss)
Comprehensive income (loss) includes changes in fair value of our aircraft fuel derivatives and interest
rate swap agreements, which qualify for hedge accounting. The differences between net income (loss) and
comprehensive income (loss) for the years ended December 31, are as follows (in millions):
2010 2009 2008
Net income (loss) ............................................ $97 $ 61 $ (84)
Gain (loss) on derivative instruments (net of $7, $54, and $68 of taxes) .... (11) 85 (103)
Total other comprehensive income (loss) ......................... (11) 85 (103)
Comprehensive income (loss) .................................. $86 $146 $(187)
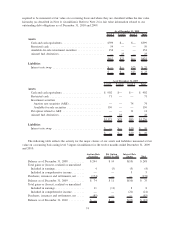
A rollforward of the amounts included in accumulated other comprehensive income (loss), net of taxes
for the years ended December 31, 2008, 2009, and 2010 is as follows (in millions):
Aircraft Fuel
Derivatives
Interest Rate
Swaps
Investment
Securities Total
Beginning accumulated gains (losses), at December 31, 2007 ... $19 $— $— $19
Reclassifications into earnings .......................... (31) — 8 (23)
Change in fair value .................................. (65) (7) (8) (80)
Balance of accumulated gains (losses), at December 31, 2008 . . . (77) (7) — (84)
Reclassifications into earnings .......................... 72 3 — 75
Change in fair value .................................. 12 (2) — 10
Balance of accumulated gains (losses), at December 31, 2009 ... 7 (6) — 1
Reclassifications into earnings .......................... 3 5 — 8
Change in fair value .................................. (6) (13) — (19)
Ending accumulated gains (losses), at December 31, 2010 ...... $ 4 $(14) $— $(10)
Note 16—Geographic Information
Under the segment reporting topic of the Codification, ASC 280, disclosures are required for operating
segments, which are regularly reviewed by the chief operating decision makers. Air transportation services
accounted for substantially all the Company’s operations in 2010, 2009 and 2008.
Operating revenues are allocated to geographic regions, as defined by the Department of Transportation,
or DOT, based upon the origination and destination of each flight segment. We currently serve 15 locations in
the Caribbean and Latin American region, or Latin America as defined by the DOT. However, our
management also includes Puerto Rico when reviewing the Caribbean region, and as such we have included
our 3 destinations in Puerto Rico in our Caribbean allocation of revenues. Operating revenues by geographic
regions for the years ended December 31 are summarized below (in millions):
2010 2009 2008
Domestic .............................................. $2,900 $2,596 $2,881
Caribbean .............................................. 879 696 511
Total ................................................. $3,779 $3,292 $3,392
Our tangible assets primarily consist of our fleet of aircraft, which is deployed system wide, with no
individual aircraft dedicated to any specific route or region; therefore our assets do not require any allocation
to a geographic area.
77