JetBlue Airlines 2010 Annual Report Download - page 43
Download and view the complete annual report
Please find page 43 of the 2010 JetBlue Airlines annual report below. You can navigate through the pages in the report by either clicking on the pages listed below, or by using the keyword search tool below to find specific information within the annual report.-
 1
1 -
2
-
3
-
4
-
5
-
6
-
7
-
8
-
9
-
10
-
11
-
12
-
13
-
14
-
15
-
16
-
17
-
18
-
19
-
20
-
21
-
22
-
23
-
24
-
25
-
26
-
27
-
28
-
29
-
30
-
31
-
32
-
 33
33 -
 34
34 -
 35
35 -
 36
36 -
 37
37 -
 38
38 -
 39
39 -
 40
40 -
 41
41 -
 42
42 -
 43
43 -
 44
44 -
 45
45 -
 46
46 -
 47
47 -
 48
48 -
 49
49 -
 50
50 -
 51
51 -
 52
52 -
 53
53 -
54
-
55
-
56
-
57
-
58
-
59
-
60
-
61
-
62
-
63
-
64
-
65
-
66
-
67
-
68
-
69
-
70
-
71
-
72
-
73
-
74
-
75
-
76
-
77
-
78
-
79
-
80
-
81
-
82
-
83
-
84
-
85
-
86
-
87
-
88
-
89
-
90
-
91
-
92
-
93
-
94
-
95
-
96
-
97
-
98
-
99
-
100
-
101
-
102
-
103
-
104
-
105
-
106
-
107
-
108
-
109
-
110
-
111
-
112
-
113
-
114
-
115
-
116
-
117
-
118
-
119
-
120
-
121
-
122
 |
 |
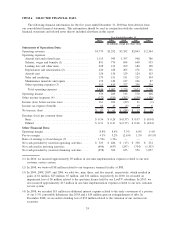
new cities in 2009, offset by a $12 million reduction in airport rents at JFK following our terminal move. Cost
per available seat mile increased 6% due to increased departures.
Depreciation and amortization increased 11%, or $23 million, primarily due to $21 million in
amortization associated with Terminal 5, which we began operating from in October 2008, and $13 million
related to an average of 93 owned and capital leased aircraft in 2009 compared to 85 in 2008. This increase
was offset by an $8 million asset write-off related to a temporary terminal facility at JFK in 2008. Cost per
available seat mile was 11% higher due to the amortization associated with Terminal 5 and having on average
eight additional owned operating aircraft.
Aircraft rent decreased 2%, or $3 million, primarily due to lower rates in effect on our aircraft under
operating leases in 2009 compared to 2008. Cost per available seat mile decreased 2% due to these lower
rates.
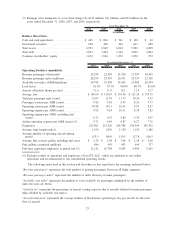
Sales and marketing expense remained relatively flat. Credit card fees were $3 million lower as a result
of decreased passenger revenues, offset by $1 million in higher advertising costs and $2 million in higher
commissions in 2009 related to our participation in GDSs and OTAs.
Maintenance materials and repairs increased 18%, or $22 million, due to eight more average operating
aircraft in 2009 compared to 2008 and the gradual aging of our fleet. The average age of our fleet increased to
4.3 years as of December 31, 2009 compared to 3.6 years as of December 31, 2008. Maintenance expense is
expected to increase significantly as our fleet ages, resulting in the need for additional repairs over time. Cost
per available seat mile increased 17% primarily due to the gradual aging of our fleet.
Other operating expenses increased 11%, or $42 million, primarily due to an increase in variable costs
associated with 5% more departures versus 2008, operating out of eight additional cities in 2009, and
increased costs due to preparations for our implementation of our new customer service system in
January 2010. Other operating expenses include the impact of $1 million and $23 million in gains on sales of
aircraft in 2009 and 2008, respectively. Other operating expenses were further offset in 2009 by $11 million
for certain tax incentives compared to $7 million in 2008. Cost per available seat mile increased 11% due
primarily to increased departures and new stations.
Other Income (Expense). Interest expense decreased 19%, or $47 million, primarily due to lower
interest rates and debt repayments, totaling approximately $59 million, offset by additional financing including
nine new aircraft and the issuance in 2009 of our 6.75% convertible Debentures, resulting in $32 million of
additional interest expense. Interest expense in 2008 included the impact of $11 million of make whole
payments from escrow in connection with the partial conversion of a portion of our 5.5% convertible
Debentures due 2038. We incurred $30 million of interest expense in 2009 related to T5, compared to
$38 million in 2008. Prior to the completion of the project in October 2008, we had capitalized $32 million of
the 2008 interest expense. The remainder of the decrease in capitalized interest was due to lower average
outstanding pre-delivery deposits and lower interest rates.
Interest income and other increased 287%, or $15 million, primarily due to a $53 million loss related to
our auction rate securities in 2008. Additionally, interest rates earned on investments were much lower in
2009, resulting in $23 million lower interest income. Interest income and other included $2 million and
$14 million in gains on the extinguishment of debt in 2009 and 2008, respectively. Derivative instruments not
qualifying for cash flow hedges in 2009 resulted in a loss of $1 million, compared to a $3 million gain in
2008. Additionally, accounting ineffectiveness on crude, heating oil, and jet fuel derivatives classified as cash
flow hedges resulted in a gain of $1 million in both 2009 and 2008. We are unable to predict what the amount
of ineffectiveness will be related to these instruments, or the potential loss of hedge accounting which is
determined on a derivative-by-derivative basis, due to the volatility in the forward markets for these
commodities.
Our effective tax rate was 41% in 2009 compared to 6% in 2008, mainly due to the nondeductibility of
$21 million related to our ARS impairment in 2008. Our effective tax rate differs from the statutory income
tax rate due to the nondeductibility of certain items for tax purposes and the relative size of these items to our
pre-tax income of $104 million in 2009 and pre-tax loss of $89 million in 2008.
34