JetBlue Airlines 2010 Annual Report Download - page 34
Download and view the complete annual report
Please find page 34 of the 2010 JetBlue Airlines annual report below. You can navigate through the pages in the report by either clicking on the pages listed below, or by using the keyword search tool below to find specific information within the annual report.-
 1
1 -
2
-
3
-
4
-
5
-
6
-
7
-
8
-
9
-
10
-
11
-
12
-
13
-
14
-
15
-
16
-
17
-
18
-
19
-
20
-
21
-
22
-
23
-
 24
24 -
 25
25 -
 26
26 -
 27
27 -
 28
28 -
 29
29 -
 30
30 -
 31
31 -
 32
32 -
 33
33 -
 34
34 -
 35
35 -
 36
36 -
 37
37 -
 38
38 -
 39
39 -
 40
40 -
 41
41 -
 42
42 -
 43
43 -
 44
44 -
45
-
46
-
47
-
48
-
49
-
50
-
51
-
52
-
53
-
54
-
55
-
56
-
57
-
58
-
59
-
60
-
61
-
62
-
63
-
64
-
65
-
66
-
67
-
68
-
69
-
70
-
71
-
72
-
73
-
74
-
75
-
76
-
77
-
78
-
79
-
80
-
81
-
82
-
83
-
84
-
85
-
86
-
87
-
88
-
89
-
90
-
91
-
92
-
93
-
94
-
95
-
96
-
97
-
98
-
99
-
100
-
101
-
102
-
103
-
104
-
105
-
106
-
107
-
108
-
109
-
110
-
111
-
112
-
113
-
114
-
115
-
116
-
117
-
118
-
119
-
120
-
121
-
122
 |
 |

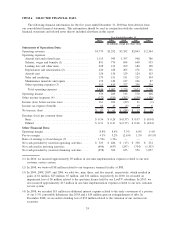
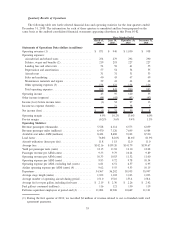
(5) Earnings were inadequate to cover fixed charges by $135 million, $11 million, and $27 million for the
years ended December 31, 2008, 2007, and 2006, respectively.
2010 2009 2008 2007 2006
As of December 31,
(in millions)
Balance Sheet Data:
Cash and cash equivalents ................ $ 465 $ 896 $ 561 $ 190 $ 10
Investment securities .................... 628 246 244 611 689
Total assets........................... 6,593 6,549 6,018 5,592 4,839
Total debt ............................ 3,033 3,304 3,144 3,022 2,804
Common stockholders’ equity ............. 1,654 1,546 1,270 1,050 972
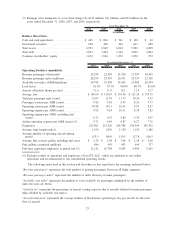
2010 2009 2008 2007 2006
Year Ended December 31,
Operating Statistics (unaudited):
Revenue passengers (thousands) ............... 24,254 22,450 21,920 21,387 18,565
Revenue passenger miles (millions) ............ 28,279 25,955 26,071 25,737 23,320
Available seat miles (ASMs)(millions) .......... 34,744 32,558 32,442 31,904 28,594
Load factor .............................. 81.4% 79.7% 80.4% 80.7% 81.6%
Aircraft utilization (hours per day) ............. 11.6 11.5 12.1 12.8 12.7
Average fare ............................. $ 140.69 $ 130.67 $ 139.56 $ 123.28 $ 119.75
Yield per passenger mile (cents) ............... 12.07 11.30 11.73 10.24 9.53
Passenger revenue per ASM (cents) ............ 9.82 9.01 9.43 8.26 7.77
Operating revenue per ASM (cents) ............ 10.88 10.11 10.45 8.91 8.27
Operating expense per ASM (cents) ............ 9.92 9.24 10.11 8.38 7.82
Operating expense per ASM, excluding fuel
(cents) ................................ 6.71 6.33 5.80 5.34 5.07
Airline operating expense per ASM (cents) (5) .... 9.71 8.99 9.87 8.27 7.76
Departures ............................... 225,501 215,526 205,389 196,594 159,152
Average stage length (miles).................. 1,100 1,076 1,120 1,129 1,186
Average number of operating aircraft during
period ................................ 153.5 148.0 139.5 127.8 106.5
Average fuel cost per gallon, including fuel taxes . . $ 2.29 $ 2.08 $ 3.08 $ 2.18 $ 2.08
Fuel gallons consumed (millions) .............. 486 455 453 444 377
Full-time equivalent employees at period end (5) . . 11,121 10,704 9,895 9,909 9,265
(5) Excludes results of operations and employees of LiveTV, LLC, which are unrelated to our airline
operations and are immaterial to our consolidated operating results.
The following terms used in this section and elsewhere in this report have the meanings indicated below:
“Revenue passengers” represents the total number of paying passengers flown on all flight segments.
“Revenue passenger miles” represents the number of miles flown by revenue passengers.
“Available seat miles” represents the number of seats available for passengers multiplied by the number of
miles the seats are flown.
“Load factor” represents the percentage of aircraft seating capacity that is actually utilized (revenue passenger
miles divided by available seat miles).
“Aircraft utilization” represents the average number of block hours operated per day per aircraft for the total
fleet of aircraft.
25