JetBlue Airlines 2010 Annual Report Download - page 39
Download and view the complete annual report
Please find page 39 of the 2010 JetBlue Airlines annual report below. You can navigate through the pages in the report by either clicking on the pages listed below, or by using the keyword search tool below to find specific information within the annual report.-
 1
1 -
2
-
3
-
4
-
5
-
6
-
7
-
8
-
9
-
10
-
11
-
12
-
13
-
14
-
15
-
16
-
17
-
18
-
19
-
20
-
21
-
22
-
23
-
24
-
25
-
26
-
27
-
28
-
 29
29 -
 30
30 -
 31
31 -
 32
32 -
 33
33 -
 34
34 -
 35
35 -
 36
36 -
 37
37 -
 38
38 -
 39
39 -
 40
40 -
 41
41 -
 42
42 -
 43
43 -
 44
44 -
 45
45 -
 46
46 -
 47
47 -
 48
48 -
 49
49 -
50
-
51
-
52
-
53
-
54
-
55
-
56
-
57
-
58
-
59
-
60
-
61
-
62
-
63
-
64
-
65
-
66
-
67
-
68
-
69
-
70
-
71
-
72
-
73
-
74
-
75
-
76
-
77
-
78
-
79
-
80
-
81
-
82
-
83
-
84
-
85
-
86
-
87
-
88
-
89
-
90
-
91
-
92
-
93
-
94
-
95
-
96
-
97
-
98
-
99
-
100
-
101
-
102
-
103
-
104
-
105
-
106
-
107
-
108
-
109
-
110
-
111
-
112
-
113
-
114
-
115
-
116
-
117
-
118
-
119
-
120
-
121
-
122
 |
 |
Our Florida and Caribbean routes experience bad weather conditions in the summer and fall due to
thunderstorms and hurricanes. As we enter new markets we could be subject to additional seasonal variations
along with competitive responses to our entry by other airlines. Given our high proportion of fixed costs, this
seasonality may cause our results of operations to vary from quarter to quarter. As such, we are currently
focused on trying to reduce the seasonal impact of our operations and increase demand and travel during the
trough periods.
Outlook for 2011
We anticipate that our continued focus in 2011 will be on our long-term sustainable growth goals and
positioning our airline for the future. We intend to do so by actively managing capital expenditures,
maintaining a rigorous focus on cost control and optimizing unit revenues while continuing to manage risk in
an uncertain and volatile economic and industry environment. We will continue to rationalize capacity to take
advantage of market opportunities and seek to balance the peaks and trough periods of the travel markets. In
addition, we continuously look to expand our other ancillary revenue opportunities and enhance the JetBlue
Experience for all of our customers, leisure and business travelers alike.
For the full year, we expect our operating capacity to increase approximately 7% to 9% over 2010 with
the net addition of four Airbus A320 aircraft and four EMBRAER 190 aircraft to our operating fleet, most of
which will be deployed in our Boston and Caribbean markets. Assuming fuel prices of $2.89 per gallon,
including fuel taxes and net of effective hedges, our cost per available seat mile for 2011 is expected to
increase by 8% to 10% over 2010. This expected increase is a result of higher maintenance costs due to the
aging of our fleet, expected increase in fuel prices, and higher salaries and wages due to pay scale
adjustments, additional headcount and higher cost of healthcare benefits.
Results of Operations
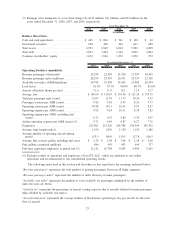
During 2010, overall economic conditions strengthened and the demand for domestic leisure and business
air travel improved significantly from 2009 conditions. Improving yields and capacity reductions by our
competitors have enhanced our ability to grow in regions and on routes where we see the most opportunity.
Average fares for the year increased 8% over 2009 to $140.69 and load factor increased 1.7 points to 81.4%
from the full year 2009. Throughout 2010, we made efforts to improve revenue performance during off-peak
travel periods by attracting new customers, continuing to refine our product and the JetBlue experience, and
offering fare sales and promotions when the markets allowed.
Our on-time performance, defined by the DOT as arrivals within 14 minutes of schedule, was 75.7% in
2010 compared to 77.5% in 2009. Our on-time performance throughout the year and on a year-over-year basis
remained challenged by the fact that a significant percentage of our flights operate out of three of the most
congested and delay-prone airports in the U.S.
Year 2010 Compared to Year 2009
We reported net income of $97 million in 2010 compared to net income of $61 million in 2009. In 2010,
we had operating income of $333 million, an increase of $48 million over 2009, and an operating margin of
8.8%, up 0.2 points from 2009. Diluted earnings per share were $0.31 for 2010 compared to diluted earnings
per share of $0.21 for 2009.
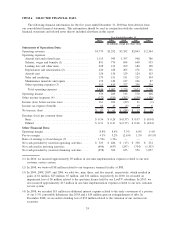
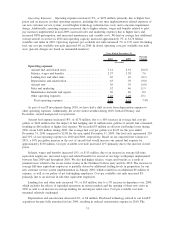
Operating Revenues. Operating revenues increased 15%, or $487 million, primarily due to a 16%
increase in passenger revenues. The $478 million increase in passenger revenues was attributable to a 7%
increase in capacity with a 7% increase in yield and a 1.7 point increase in load factor over 2009, amounts
which include capacity reductions during the initial cutover period to our new customer service system in the
first quarter of 2010. Included in this amount is a $14 million increase in Even More Legroom revenue as a
result of increased capacity and revised pricing.
Other revenues increased 3%, or $9 million, primarily due to a $10 million increase in marketing related
revenues, higher excess baggage revenue of $4 million and increased rates for certain ancillary services during
2010. Other revenue also increased $3 million due to higher inflight food and beverage sales, but was offset
by a $10 million reduction in change fees and reservation fees as a result of high levels of change fee waivers
during the first half of 2010 in conjunction with our new system migration.
30