JetBlue Airlines 2010 Annual Report Download - page 45
Download and view the complete annual report
Please find page 45 of the 2010 JetBlue Airlines annual report below. You can navigate through the pages in the report by either clicking on the pages listed below, or by using the keyword search tool below to find specific information within the annual report.-
 1
1 -
2
-
3
-
4
-
5
-
6
-
7
-
8
-
9
-
10
-
11
-
12
-
13
-
14
-
15
-
16
-
17
-
18
-
19
-
20
-
21
-
22
-
23
-
24
-
25
-
26
-
27
-
28
-
29
-
30
-
31
-
32
-
33
-
34
-
 35
35 -
 36
36 -
 37
37 -
 38
38 -
 39
39 -
 40
40 -
 41
41 -
 42
42 -
 43
43 -
 44
44 -
 45
45 -
 46
46 -
 47
47 -
 48
48 -
 49
49 -
 50
50 -
 51
51 -
 52
52 -
 53
53 -
 54
54 -
 55
55 -
56
-
57
-
58
-
59
-
60
-
61
-
62
-
63
-
64
-
65
-
66
-
67
-
68
-
69
-
70
-
71
-
72
-
73
-
74
-
75
-
76
-
77
-
78
-
79
-
80
-
81
-
82
-
83
-
84
-
85
-
86
-
87
-
88
-
89
-
90
-
91
-
92
-
93
-
94
-
95
-
96
-
97
-
98
-
99
-
100
-
101
-
102
-
103
-
104
-
105
-
106
-
107
-
108
-
109
-
110
-
111
-
112
-
113
-
114
-
115
-
116
-
117
-
118
-
119
-
120
-
121
-
122
 |
 |
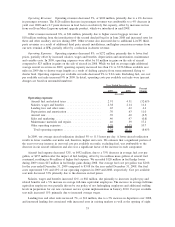
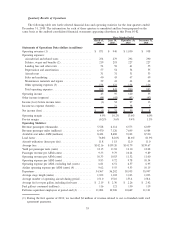
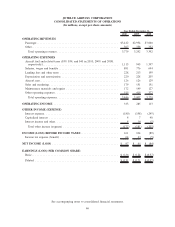
(2) During 2010, we incurred approximately $9 million in salaries, wages and benefits related to the one time
implementation of our new customer service system, $6 million of which was incurred in the first quarter
of 2010.
(3) During 2010, we incurred approximately $13 million in one-time, non-recurring implementation related
expenses for our new customer service system, $10 million of which was incurred in the first quarter of
2010. During the third quarter of 2010, we recorded a $6 million impairment loss related to a spectrum
license held by our LiveTV subsidiary.
(4) Excludes results of operations and employees of LiveTV, LLC, which are unrelated to our airline
operations and are immaterial to our consolidated operating results.
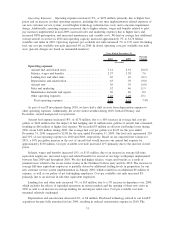
Although we experienced significant revenue growth in 2010, this trend may not continue. We expect our
expenses to continue to increase significantly as we acquire additional aircraft, as our fleet ages and as we
expand the frequency of flights in existing markets and enter into new markets. Accordingly, the comparison
of the financial data for the quarterly periods presented may not be meaningful. In addition, we expect our
operating results to fluctuate significantly from quarter-to-quarter in the future as a result of various factors,
many of which are outside our control. Consequently, we believe that quarter-to-quarter comparisons of our
operating results may not necessarily be meaningful and you should not rely on our results for any one quarter
as an indication of our future performance.
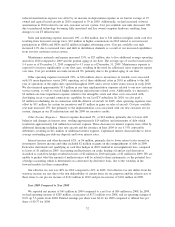
Liquidity and Capital Resources
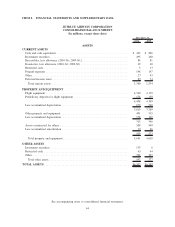
At December 31, 2010, we had cash and cash equivalents of $465 million and short term investments of
$495 million, as compared to cash and cash equivalents of $896 million and short term investments of
$240 million at December 31, 2009. We also had $133 million of long-term investments at December 31,
2010 compared to $6 million at December 31, 2009. Cash flows provided by operating activities totaled
$523 million in 2010 compared to $486 million in 2009 and cash flows used in operating activities of
$17 million in 2008. The $37 million increase in cash flows from operations in 2010 compared to 2009 was
primarily as a result of the 8% increase in average fares, 7% increase in capacity, and 1.7 point increase in
load factor, offset by 10% higher price of fuel in 2010 compared to 2009. The $503 million increase in cash
flows from operations in 2009 compared to 2008 was primarily a result of a 33% lower price of fuel in 2009
compared to 2008 and the $149 million in collateral we posted for margin calls related to our outstanding fuel
hedge and interest rate swap contracts in 2008, most of which was returned to us during 2009. We also posted
$70 million in restricted cash that collateralized letters of credit issued to certain of our business partners in
2008, including $55 million for our primary credit card processor. In 2009, $65 million of the restricted cash
was returned to us. We rely primarily on cash flows from operations to provide working capital for current and
future operations.
Investing Activities. During 2010, capital expenditures related to our purchase of flight equipment
included $142 million for four aircraft and five spare engines, $50 million for flight equipment deposits and
$14 million for spare part purchases. Capital expenditures for other property and equipment, including ground
equipment purchases, facilities improvements and LiveTV inventory, were $93 million. Investing activities in
2010 also included the net purchase of $384 million in investment securities.
During 2009, capital expenditures related to our purchase of flight equipment included $313 million for
11 aircraft and two spare engines, $27 million for flight equipment deposits and $13 million for spare part
purchases. Capital expenditures for other property and equipment, including ground equipment purchases and
facilities improvements, were $108 million. Proceeds from the sale of certain auction rate securities were
$175 million. Expenditures related to the construction of our terminal at JFK totaled $47 million. Investing
activities in 2009 also included the net purchase of $172 million in investment securities. Other investing
activities included the receipt of $58 million in proceeds from the sale of two EMBRAER 190 aircraft.
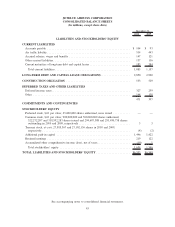
Financing Activities. Financing activities during 2010 consisted primarily of (1) the required repurchase
of $156 million of our 3.75% convertible debentures due 2035, (2) the net repayment of $56 million on our
line of credit collateralized by our auction rate securities, or ARS, (3) scheduled maturities of $177 million of
debt and capital lease obligations, (4) our issuance of $47 million in fixed rate equipment notes and
$69 million in non-public floating rate equipment notes secured by four EMBRAER 190 aircraft and five
36