JetBlue Airlines 2010 Annual Report Download - page 114
Download and view the complete annual report
Please find page 114 of the 2010 JetBlue Airlines annual report below. You can navigate through the pages in the report by either clicking on the pages listed below, or by using the keyword search tool below to find specific information within the annual report.-
 1
1 -
2
-
3
-
4
-
5
-
6
-
7
-
8
-
9
-
10
-
11
-
12
-
13
-
14
-
15
-
16
-
17
-
18
-
19
-
20
-
21
-
22
-
23
-
24
-
25
-
26
-
27
-
28
-
29
-
30
-
31
-
32
-
33
-
34
-
35
-
36
-
37
-
38
-
39
-
40
-
41
-
42
-
43
-
44
-
45
-
46
-
47
-
48
-
49
-
50
-
51
-
52
-
53
-
54
-
55
-
56
-
57
-
58
-
59
-
60
-
61
-
62
-
63
-
64
-
65
-
66
-
67
-
68
-
69
-
70
-
71
-
72
-
73
-
74
-
75
-
76
-
77
-
78
-
79
-
80
-
81
-
82
-
83
-
84
-
85
-
86
-
87
-
88
-
89
-
90
-
91
-
92
-
93
-
94
-
95
-
96
-
97
-
98
-
99
-
100
-
101
-
102
-
103
-
 104
104 -
 105
105 -
 106
106 -
 107
107 -
 108
108 -
 109
109 -
 110
110 -
 111
111 -
 112
112 -
 113
113 -
 114
114 -
 115
115 -
 116
116 -
 117
117 -
 118
118 -
 119
119 -
 120
120 -
 121
121 -
 122
122
 |
 |

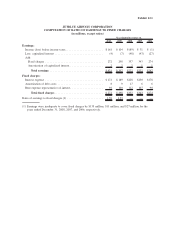
Exhibit 12.1
JETBLUE AIRWAYS CORPORATION
COMPUTATION OF RATIO OF EARNINGS TO FIXED CHARGES
(in millions, except ratios)
2010 2009 2008 2007 2006
Year Ended December 31,
Earnings:
Income (loss) before income taxes ........................ $161 $104 $(89) $ 31 $ (1)
Less: capitalized interest ............................... (4) (7) (48) (43) (27)
Add:
Fixed charges ..................................... 272 298 357 343 274
Amortization of capitalized interest ..................... 2 2 2 1 1
Total earnings .................................. $431 $397 $222 $332 $247
Fixed charges:
Interest expense ..................................... $172 $189 $228 $230 $178
Amortization of debt costs ............................. 8 9 17 6 6
Rent expense representative of interest..................... 92 100 112 107 90
Total fixed charges ............................... $272 $298 $357 $343 $274
Ratio of earnings to fixed charges (1) ....................... 1.59 1.33 — — —
(1) Earnings were inadequate to cover fixed charges by $135 million, $11 million, and $27 million for the
years ended December 31, 2008, 2007, and 2006, respectively.