JetBlue Airlines 2010 Annual Report Download - page 83
Download and view the complete annual report
Please find page 83 of the 2010 JetBlue Airlines annual report below. You can navigate through the pages in the report by either clicking on the pages listed below, or by using the keyword search tool below to find specific information within the annual report.-
 1
1 -
2
-
3
-
4
-
5
-
6
-
7
-
8
-
9
-
10
-
11
-
12
-
13
-
14
-
15
-
16
-
17
-
18
-
19
-
20
-
21
-
22
-
23
-
24
-
25
-
26
-
27
-
28
-
29
-
30
-
31
-
32
-
33
-
34
-
35
-
36
-
37
-
38
-
39
-
40
-
41
-
42
-
43
-
44
-
45
-
46
-
47
-
48
-
49
-
50
-
51
-
52
-
53
-
54
-
55
-
56
-
57
-
58
-
59
-
60
-
61
-
62
-
63
-
64
-
65
-
66
-
67
-
68
-
69
-
70
-
71
-
72
-
 73
73 -
 74
74 -
 75
75 -
 76
76 -
 77
77 -
 78
78 -
 79
79 -
 80
80 -
 81
81 -
 82
82 -
 83
83 -
 84
84 -
 85
85 -
 86
86 -
 87
87 -
 88
88 -
 89
89 -
 90
90 -
 91
91 -
 92
92 -
 93
93 -
94
-
95
-
96
-
97
-
98
-
99
-
100
-
101
-
102
-
103
-
104
-
105
-
106
-
107
-
108
-
109
-
110
-
111
-
112
-
113
-
114
-
115
-
116
-
117
-
118
-
119
-
120
-
121
-
122
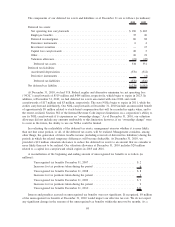
 |
 |

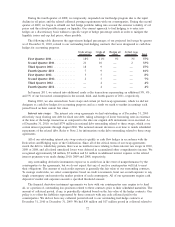
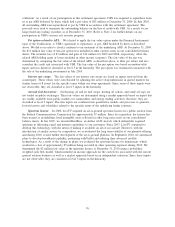
required to be measured at fair value on a recurring basis and where they are classified within the fair value
hierarchy (as described in Note 1) (in millions). Refer to Note 2 for fair value information related to our
outstanding debt obligations as of December 31, 2010 and 2009.
Level 1 Level 2 Level 3 Total
As of December 31, 2010
Assets
Cash and cash equivalents ........................... $399 $— $— $399
Restricted cash ................................... 59 — — 59
Available-for-sale investment securities . ................ 154 — — 154
Aircraft fuel derivatives ............................. — 23 — 23
$612 $23 $— $635
Liabilities
Interest rate swap ................................. $ — $— $23 $ 23
$ — $— $23 $ 23
Level 1 Level 2 Level 3 Total
As of December 31, 2009
Assets
Cash and cash equivalents ......................... $ 902 $— $— $ 902
Restricted cash ................................. 71 — — 71
Investment securities
Auction rate securities (ARS) ..................... — — 74 74
Available-for-sale securities ...................... 150 — — 150
Put option related to ARS ......................... — — 11 11
Aircraft fuel derivatives ........................... — 28 — 28
$1,123 $28 $85 $1,236
Liabilities
Interest rate swap ............................... $ — $— $10 $ 10
$ — $— $10 $ 10
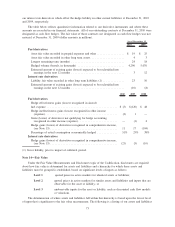
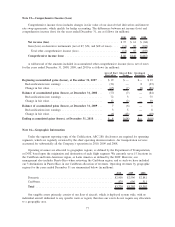
The following table reflects the activity for the major classes of our assets and liabilities measured at fair
value on a recurring basis using level 3 inputs (in millions) for the twelve months ended December 31, 2009
and 2010:
Auction Rate
Securities
Put Option
related to ARS
Interest Rate
Swaps Total
Balance as of December 31, 2008 .......... $244 $14 $(10) $ 248
Total gains or (losses), realized or unrealized
Included in earnings................... 4 (3) (5) (4)
Included in comprehensive income ........ — — 5 5
Purchases, issuances and settlements, net ..... (174) — — (174)
Balance as of December 31, 2009 .......... $ 74 $11 $(10) $ 75
Total gains or (losses), realized or unrealized
Included in earnings................... 11 (11) 8 8
Included in comprehensive income ........ — — (21) (21)
Purchases, issuances and settlements, net ..... (85) — — (85)
Balance as of December 31, 2010 .......... $ — $— $(23) $ (23)
74