IBM 1997 Annual Report Download - page 80
Download and view the complete annual report
Please find page 80 of the 1997 IBM annual report below. You can navigate through the pages in the report by either clicking on the pages listed below, or by using the keyword search tool below to find specific information within the annual report.-
 1
1 -
2
-
3
-
4
-
5
-
6
-
7
-
8
-
9
-
10
-
11
-
12
-
13
-
14
-
15
-
16
-
17
-
18
-
19
-
20
-
21
-
22
-
23
-
24
-
25
-
26
-
27
-
28
-
29
-
30
-
31
-
32
-
33
-
34
-
35
-
36
-
37
-
38
-
39
-
40
-
41
-
42
-
43
-
44
-
45
-
46
-
47
-
48
-
49
-
50
-
51
-
52
-
53
-
54
-
55
-
56
-
57
-
58
-
59
-
60
-
61
-
62
-
63
-
64
-
65
-
66
-
67
-
68
-
69
-
 70
70 -
 71
71 -
 72
72 -
 73
73 -
 74
74 -
 75
75 -
 76
76 -
 77
77 -
 78
78 -
 79
79 -
 80
80 -
 81
81 -
 82
82 -
 83
83 -
 84
84
 |
 |

78
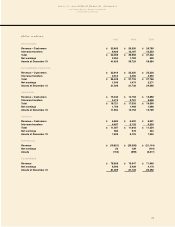
International Business Machines Corporation
and Subsidiary Companies
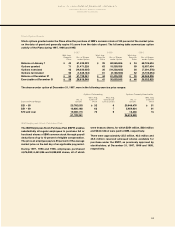
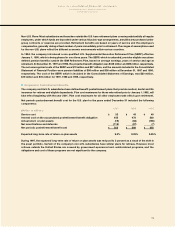
Five-Year Comparison of Selected Financial Data
(Dollars in millions except per share amounts)
For the year: 1997 1996 1995 1994 1993
Revenue $78,508 $75,947 $71,940 $64,052 $62,716
Net earnings (loss) before
changes in accounting principles 6,093 5,429 4,178 3,021 (7,987)
Per share of common stock 6.18 5.12 3.61 2.51 (7.01)
Effect of accounting changes*– – – – (114)
Per share of common stock – – – – (.10)
Net earnings (loss) 6,093 5,429 4,178 3,021 (8,101)
Per share of common stock 6.18 5.12 3.61 2.51 (7.11)
Per share of common stock – assuming dilution 6.01 5.01 3.53 2.48 (7.11)
Cash dividends paid on common stock 763 686 572 585 905
Per share of common stock .775 .65 .50 .50 .79
Investment in plant, rental machines
and other property 6,793 5,883 4,744 3,078 3,232
Return on stockholders’ equity 29.7% 24.8% 18.5% 14.3% –
At end of year:
Total assets $81,499 $81,132 $80,292 $81,091 $81,113
Net investment in plant, rental machines
and other property 18,347 17,407 16,579 16,664 17,521
Working capital 6,911 6,695 9,043 12,112 6,052
Total debt 26,926 22,829 21,629 22,118 27,342
Stockholders’ equity 19,816 21,628 22,423 23,413 19,738
*1993, postemployment benefits.
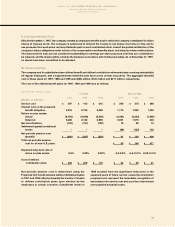
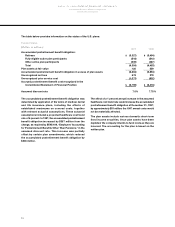
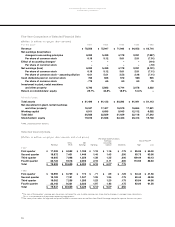
Selected Quarterly Data
(Dollars in millions except per share amounts and stock prices) Per Share Common Stock
Earnings Stock Prices**
Gross Net Assuming
Revenue Profit Earnings Earnings Dilution Dividends High Low
1997
First quarter $17,308 $6,592 $1,195 $1.18 $1.16 $.175 $85.06 $65.00
Second quarter 18,872 7,401 1,446 1.46 1.43 .200 93.75 63.56
Third quarter 18,605 7,098 1,359 1.38 1.35 .200 109.44 90.13
Fourth quarter 23,723 9,518 2,093 2.16 2.11 .200 113.50 88.63
___________________ ________________ ______________ _____________ _____________ _____________
Total $78,508 $30,609 $6,093 $6.18 $6.01*$.775
1996
First quarter $16,559 $6,769 $774 $.71 $.69 $.125 $64.44 $41.56
Second quarter 18,183 7,191 1,347 1.26 1.24 .175 60.44 48.06
Third quarter 18,062 7,258 1,285 1.23 1.20 .175 63.94 44.56
Fourth quarter 23,143 9,321 2,023 1.97 1.93 .175 83.00 61.56
___________________ ________________ ______________ ______________ _____________ _____________
Total $75,947 $30,539 $5,429 $5.12*$5.01*$.650
**The sum of the quarters’ earnings per share does not equal the year-to-date earnings per share due to changes in average share calculations.
This is in accordance with prescribed reporting requirements.
** The stock prices reflect the high and low prices for IBM’s common stock on the New York Stock Exchange composite tape for the last two years.