IBM 1997 Annual Report Download - page 69
Download and view the complete annual report
Please find page 69 of the 1997 IBM annual report below. You can navigate through the pages in the report by either clicking on the pages listed below, or by using the keyword search tool below to find specific information within the annual report.-
 1
1 -
2
-
3
-
4
-
5
-
6
-
7
-
8
-
9
-
10
-
11
-
12
-
13
-
14
-
15
-
16
-
17
-
18
-
19
-
20
-
21
-
22
-
23
-
24
-
25
-
26
-
27
-
28
-
29
-
30
-
31
-
32
-
33
-
34
-
35
-
36
-
37
-
38
-
39
-
40
-
41
-
42
-
43
-
44
-
45
-
46
-
47
-
48
-
49
-
50
-
51
-
52
-
53
-
54
-
55
-
56
-
57
-
58
-
 59
59 -
 60
60 -
 61
61 -
 62
62 -
 63
63 -
 64
64 -
 65
65 -
 66
66 -
 67
67 -
 68
68 -
 69
69 -
 70
70 -
 71
71 -
 72
72 -
 73
73 -
 74
74 -
 75
75 -
 76
76 -
 77
77 -
 78
78 -
 79
79 -
80
-
81
-
82
-
83
-
84
 |
 |

67
notes to consolidated financial statements
International Business Machines Corporation
and Subsidiary Companies
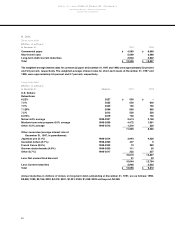
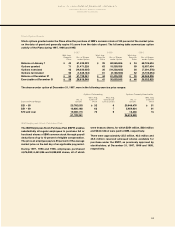
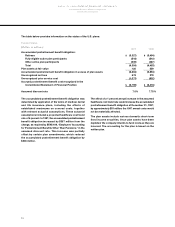
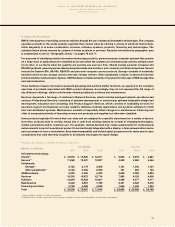
R Net Earnings Per Share of Common Stock
The following table sets forth the computation of basic and diluted earnings per share.
For the year ended December 31: 1997 1996 1995 1994 1993
Number of shares on which basic
earnings per share is calculated:
Average outstanding during year 983,286,361 1,056,704,188 1,138,768,058 1,169,917,398 1,146,478,480
Add – Incremental shares under
stock compensation plans 27,648,581 23,004,716 18,446,278 8,616,538 –
– Incremental shares related
to 5.75% convertible
bonds (average) – – 10,582,196 15,430,782 –
________________________ ________________________ ________________________ ________________________ ________________________
Number of shares on which diluted
earnings per share is calculated 1,010,934,942 1,079,708,904 1,167,796,532 1,193,964,718 1,146,478,480
Net earnings (loss)
applicable to common
shareholders (millions) $6,073 $5,409 $4,116 $2,937 $(8,148)
Net earnings effect
of interest on 5.75%
convertible bonds (millions) – – 1 19 –
Net earnings (loss) on which
diluted earnings per share
is calculated (millions) $6,073 $5,409 $4,117 $2,956 $(8,148)
Basic earnings (loss) per share $6.18 $5.12 $3.61 $2.51 $(7.11)
Diluted earnings (loss) per share $6.01 $5.01 $3.53 $2.48 $(7.11)
Stock options to purchase 165,833 shares in 1997, 784,141 shares in 1996, 10,304,286 shares in 1995 and 14,531,336 shares
in 1994 were outstanding, but were not included in the computation of diluted earnings per share because the options’
exercise price was greater than the average market price of the common shares, and therefore, the effect would be
antidilutive. In 1993, the incremental shares under stock plans (58,971,448 shares) and the effect of the convertible
bonds (15,430,800 shares) were not considered for the diluted earnings per share calculation due to their antidilutive effect.
As such, the amounts reported for basic and diluted earnings per share are the same.