IBM 1997 Annual Report Download - page 61
Download and view the complete annual report
Please find page 61 of the 1997 IBM annual report below. You can navigate through the pages in the report by either clicking on the pages listed below, or by using the keyword search tool below to find specific information within the annual report.-
 1
1 -
2
-
3
-
4
-
5
-
6
-
7
-
8
-
9
-
10
-
11
-
12
-
13
-
14
-
15
-
16
-
17
-
18
-
19
-
20
-
21
-
22
-
23
-
24
-
25
-
26
-
27
-
28
-
29
-
30
-
31
-
32
-
33
-
34
-
35
-
36
-
37
-
38
-
39
-
40
-
41
-
42
-
43
-
44
-
45
-
46
-
47
-
48
-
49
-
50
-
 51
51 -
 52
52 -
 53
53 -
 54
54 -
 55
55 -
 56
56 -
 57
57 -
 58
58 -
 59
59 -
 60
60 -
 61
61 -
 62
62 -
 63
63 -
 64
64 -
 65
65 -
 66
66 -
 67
67 -
 68
68 -
 69
69 -
 70
70 -
 71
71 -
72
-
73
-
74
-
75
-
76
-
77
-
78
-
79
-
80
-
81
-
82
-
83
-
84
 |
 |

notes to consolidated financial statements
International Business Machines Corporation
and Subsidiary Companies
59
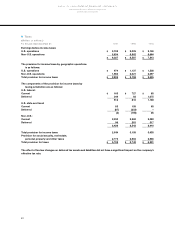
HInterest on Debt
Interest paid and accrued on borrowings of the company and its subsidiaries amounted to $1,596 million in 1997,
$1,565 million in 1996 and $1,600 million in 1995. Of these amounts, $32 million in 1997, $31 million in 1996 and $23 million
in 1995 were capitalized. The remainder was charged to the cost of rentals and financing, or interest expense. The increase
in interest expense is primarily due to higher levels of debt, partially offset by lower average interest rates in 1997 versus
1996. The decrease in interest expense in 1996 versus 1995 was primarily a result of lower average interest rates. The
average interest rate for total debt was 6.4 percent, 7.0 percent and 7.2 percent in 1997, 1996 and 1995, respectively. These
rates reflect the results of currency and interest rate swaps applied to the debt described in note G, “Debt,” on page 58.
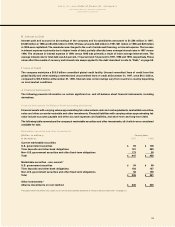
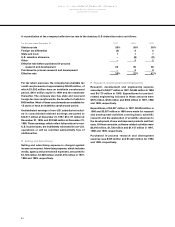
I Lines of Credit
The company maintains a $10.0 billion committed global credit facility. Unused committed lines of credit from this
global facility and other existing committed and uncommitted lines of credit at December 31, 1997, were $13.1 billion,
compared to $13.9 billion at December 31, 1996. Interest rates on borrowings vary from country to country depending
on local market conditions.
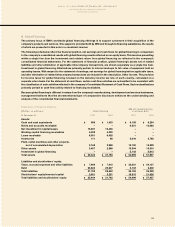
J Financial Instruments
The following presents information on certain significant on- and off-balance sheet financial instruments, including
derivatives.
Financial Instruments On-Balance Sheet (excluding derivatives)
Financial assets with carrying values approximating fair value include cash and cash equivalents, marketable securities,
notes and other accounts receivable and other investments. Financial liabilities with carrying values approximating fair
value include accounts payable and other accrued expenses and liabilities, and short-term and long-term debt.
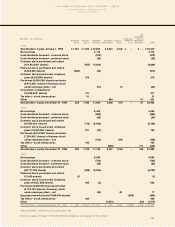
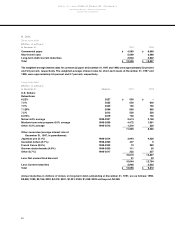
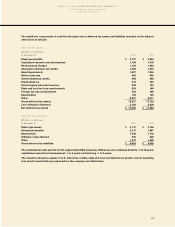
The following table summarizes the company’s marketable securities and other investments, all of which were considered
available for sale.
Marketable securities and other investments
(Dollars in millions) Carrying Value
At December 31: 1997 1996
Current marketable securities:
U.S. government securities $93 $108
Time deposits and other bank obligations 181 283
Non-U.S. government securities and other fixed-term obligations 173 59
_____________ _____________
Total $447 $450
Marketable securities - non-current:*
U.S. government securities $54 $99
Time deposits and other bank obligations 183 127
Non-U.S. government securities and other fixed-term obligations 58 155
_____________ _____________
Total $295 $381
Other investments:*
Alliance investments on cost method $236 $320
*Included within Investments and sundry assets on the Consolidated Statement of Financial Position (See note F on page 57).