IBM 1997 Annual Report Download - page 54
Download and view the complete annual report
Please find page 54 of the 1997 IBM annual report below. You can navigate through the pages in the report by either clicking on the pages listed below, or by using the keyword search tool below to find specific information within the annual report.-
 1
1 -
2
-
3
-
4
-
5
-
6
-
7
-
8
-
9
-
10
-
11
-
12
-
13
-
14
-
15
-
16
-
17
-
18
-
19
-
20
-
21
-
22
-
23
-
24
-
25
-
26
-
27
-
28
-
29
-
30
-
31
-
32
-
33
-
34
-
35
-
36
-
37
-
38
-
39
-
40
-
41
-
42
-
43
-
 44
44 -
 45
45 -
 46
46 -
 47
47 -
 48
48 -
 49
49 -
 50
50 -
 51
51 -
 52
52 -
 53
53 -
 54
54 -
 55
55 -
 56
56 -
 57
57 -
 58
58 -
 59
59 -
 60
60 -
 61
61 -
 62
62 -
 63
63 -
 64
64 -
65
-
66
-
67
-
68
-
69
-
70
-
71
-
72
-
73
-
74
-
75
-
76
-
77
-
78
-
79
-
80
-
81
-
82
-
83
-
84
 |
 |

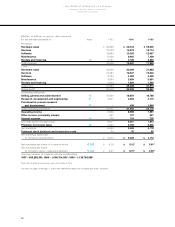
(Dollars in millions)
For the year ended December 31: 1997 1996 1995
Cash flow from operating activities:
Net earnings $6,093 $5,429 $4,178
Adjustments to reconcile net earnings to cash
provided from operating activities:
Depreciation 4,018 3,676 3,955
Amortization of software 983 1,336 1,647
Effect of restructuring charges (445) (1,491) (2,119)
Purchased in-process research and development –435 1,840
Deferred income taxes 358 11 1,392
Gain on disposition of fixed and other assets (273) (300) (339)
Other changes that (used) provided cash:
Receivables (3,727) (650) (530)
Inventories 432 196 107
Other assets (1,087) (980) (1,100)
Accounts payable 699 319 659
Other liabilities 1,814 2,294 1,018
Net cash provided from operating activities 8,865 10,275 10,708
Cash flow from investing activities:
Payments for plant, rental machines and other property (6,793) (5,883) (4,744)
Proceeds from disposition of plant, rental machines
and other property 1,130 1,314 1,561
Acquisitions of Tivoli Systems, Inc. and Lotus
Development Corporation – net, 1996 and 1995, respectively –(716) (2,880)
Investment in software (314) (295) (823)
Purchases of marketable securities and other investments (1,617) (1,613) (1,315)
Proceeds from marketable securities and other investments 1,439 1,470 3,149
Net cash used in investing activities (6,155) (5,723) (5,052)
Cash flow from financing activities:
Proceeds from new debt 9,142 7,670 6,636
Short-term borrowings less than 90 days – net (668) (919) 2,557
Payments to settle debt (4,530) (4,992) (9,460)
Preferred stock transactions – net (1) – (870)
Common stock transactions – net (6,250) (5,005) (4,656)
Cash dividends paid (783) (706) (591)
Net cash used in financing activities (3,090) (3,952) (6,384)
Effect of exchange rate changes on cash and
cash equivalents (201) (172) 65
Net change in cash and cash equivalents (581) 428 (663)
Cash and cash equivalents at January 1 7,687 7,259 7,922
Cash and cash equivalents at December 31 $7,106 $7,687 $7,259
Supplemental data:
Cash paid during the year for:
Income taxes $2,472 $2,229 $1,453
Interest $1,475 $1,563 $1,720
The notes on pages 54 through 77 of the 1997 IBM Annual Report are an integral part of this statement.
consolidated statement of cash flows
International Business Machines Corporation
and Subsidiary Companies
52