IBM 1997 Annual Report Download - page 68
Download and view the complete annual report
Please find page 68 of the 1997 IBM annual report below. You can navigate through the pages in the report by either clicking on the pages listed below, or by using the keyword search tool below to find specific information within the annual report.-
 1
1 -
2
-
3
-
4
-
5
-
6
-
7
-
8
-
9
-
10
-
11
-
12
-
13
-
14
-
15
-
16
-
17
-
18
-
19
-
20
-
21
-
22
-
23
-
24
-
25
-
26
-
27
-
28
-
29
-
30
-
31
-
32
-
33
-
34
-
35
-
36
-
37
-
38
-
39
-
40
-
41
-
42
-
43
-
44
-
45
-
46
-
47
-
48
-
49
-
50
-
51
-
52
-
53
-
54
-
55
-
56
-
57
-
 58
58 -
 59
59 -
 60
60 -
 61
61 -
 62
62 -
 63
63 -
 64
64 -
 65
65 -
 66
66 -
 67
67 -
 68
68 -
 69
69 -
 70
70 -
 71
71 -
 72
72 -
 73
73 -
 74
74 -
 75
75 -
 76
76 -
 77
77 -
 78
78 -
79
-
80
-
81
-
82
-
83
-
84
 |
 |

66
notes to consolidated financial statements
International Business Machines Corporation
and Subsidiary Companies
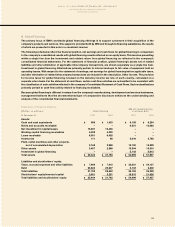
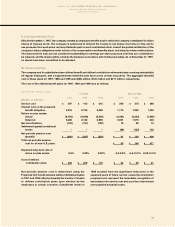
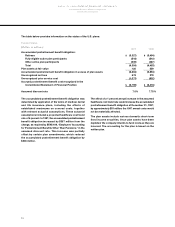
Statement of Earnings
IBM with Global Financing
(Dollars in millions) Global Financing on an Equity Basis
For the year ended December 31: 1997 1996 1995 1997 1996 1995
Finance and other income:
Finance income $1,833 $2,048 $2,110 $–$–$–
Rental income – net 603 509 415 527 590 469
Sales and services 788 809 1,001 74,421 71,798 67,588
Other income 339 320 367 1,119 1,381 1,473
________________ _________________ _______________ ________________ ________________ ________________
Total finance and other income 3,563 3,686 3,893 76,067 73,769 69,530
Interest and other costs and expenses 2,432 2,426 2,782 67,040 65,182 61,717
________________ _________________ _______________ ________________ ________________ ________________
Net earnings before income taxes 1,131 1,260 1,111 9,027 8,587 7,813
Provision for income taxes 429 531 428 2,934 3,158 3,635
________________ _________________ _______________ ________________ ________________ ________________
Net earnings $702 $729 $683 $6,093 $5,429 $4,178
Global financing earnings yielded a return on average invested capital of 20.3 percent in 1997, compared to
22.7 percent in 1996. Included within these results are intracompany services and fees received for tax benefits
provided to the company resulting from tax deferrals generated by financing transactions. Such fees are eliminated
from the Consolidated Statement of Earnings.
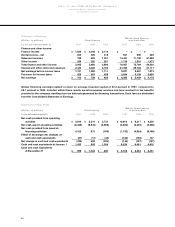
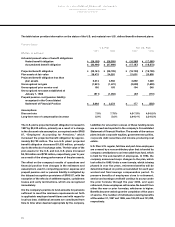
Statement of Cash Flows
IBM with Global Financing
(Dollars in millions) Global Financing on an Equity Basis
For the year ended December 31: 1997 1996 1995 1997 1996 1995
Net cash provided from operating
activities $3,919 $5,314 $3,712 $10,910 $8,217 $9,250
Net cash used in investing activities (8,435) (5,544) (3,968) (3,684) (3,435) (3,338)
Net cash provided from (used in)
financing activities 4,102 872 (198) (7,192) (4,824) (6,186)
Effect of exchange rate changes on
cash and cash equivalents (21) (17) (42) (180) (155) 107
Net change in cash and cash equivalents (435) 625 (496) (146) (197) (167)
Cash and cash equivalents at January 1 1,433 808 1,304 6,254 6,451 6,618
Cash and cash equivalents
at December 31 $998 $1,433 $808 $6,108 $6,254 $6,451