IBM 1997 Annual Report Download - page 44
Download and view the complete annual report
Please find page 44 of the 1997 IBM annual report below. You can navigate through the pages in the report by either clicking on the pages listed below, or by using the keyword search tool below to find specific information within the annual report.-
 1
1 -
2
-
3
-
4
-
5
-
6
-
7
-
8
-
9
-
10
-
11
-
12
-
13
-
14
-
15
-
16
-
17
-
18
-
19
-
20
-
21
-
22
-
23
-
24
-
25
-
26
-
27
-
28
-
29
-
30
-
31
-
32
-
33
-
 34
34 -
 35
35 -
 36
36 -
 37
37 -
 38
38 -
 39
39 -
 40
40 -
 41
41 -
 42
42 -
 43
43 -
 44
44 -
 45
45 -
 46
46 -
 47
47 -
 48
48 -
 49
49 -
 50
50 -
 51
51 -
 52
52 -
 53
53 -
 54
54 -
55
-
56
-
57
-
58
-
59
-
60
-
61
-
62
-
63
-
64
-
65
-
66
-
67
-
68
-
69
-
70
-
71
-
72
-
73
-
74
-
75
-
76
-
77
-
78
-
79
-
80
-
81
-
82
-
83
-
84
 |
 |

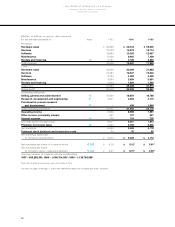
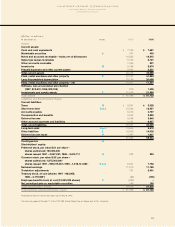
Services
(Dollars in millions)
1997 1996 1995
Revenue $19,302 $15,873 $12,714
Cost 15,281 12,647 10,042
__________________ _________________ _________________
Gross profit $4,021 $3,226 $2,672
Gross profit margin 20.8% 20.3% 21.0%
Services revenue increased 21.6 percent in 1997 (up
about 28 percent in constant currency) from 1996 and
24.8 percent in 1996 over 1995. The increases were driven
by continued strong growth in professional services,
which includes managed operation of systems, as well as
systems integration design and development. Network
services, which includes managed operation of networks,
and product support services continued to experience
good growth in revenue year over year. In 1997, the
company signed service contracts worth $24 billion. The
company continued to meet this growing demand for its
services business by hiring over 15,000 employees in
both 1997 and 1996, while maintaining a consistent gross
profit margin.
Software
(Dollars in millions)
1997 1996 1995
Revenue $12,844 $13,052 $12,657
Cost 3,784 4,082 4,428
__________________ _________________ _________________
Gross profit $9,060 $8,970 $8,229
Gross profit margin 70.5% 68.7% 65.0%
Software revenue decreased 1.6 percent in 1997 (up about
4 percent in constant currency) from 1996, following an
increase of 3.1 percent in 1996 over 1995. The revenue
decrease in 1997 was a result of lower host-based
computer software revenue primarily associated with
System/390 products. This decrease was offset by revenue
growth for systems management software from Tivoli.
While down for the year, software revenue performance
strengthened over the course of the year with fourth
quarter 1997 revenue increasing 1.4 percent versus the
fourth quarter of 1996. The increase in 1996 revenue was
driven by distributed software offerings from Lotus and
software products from Tivoli, partially offset by lower
host-based computer software revenue from System/390
and AS/400.
Software gross profit dollars increased 1.0 percent in
1997 from 1996, following an increase of 9.0 percent in
1996 from 1995. The improvement in gross profit dollars
was the result of more software development spending
being expensed in the period incurred and less being
capitalized in relation to prior historical levels, which in
turn yielded less amortization of previously deferred
costs. These lower amortization costs were partially
offset by higher vendor royalty costs.
Maintenance
(Dollars in millions)
1997 1996 1995
Revenue $6,402 $6,981 $7,409
Cost 3,394 3,659 3,651
__________________ __________________ __________________
Gross profit $3,008 $3,322 $3,758
Gross profit margin 47.0% 47.6% 50.7%
Maintenance revenue decreased 8.3 percent in 1997
(down about 3 percent in constant currency) from 1996,
following a decrease of 5.8 percent in 1996 versus 1995.
Gross profit dollars decreased 9.5 percent, following a
decrease of 11.6 percent in 1996 from 1995. Revenue and
gross profit dollars continue to be affected by price
reductions on maintenance offerings.
Rentals and Financing
(Dollars in millions)
1997 1996 1995
Revenue $3,731 $3,725 $3,560
Cost 1,902 1,624 1,590
__________________ __________________ __________________
Gross profit $1,829 $2,101 $1,970
Gross profit margin 49.0% 56.4% 55.4%
Rentals and financing revenue was essentially flat (up
about 4 percent in constant currency) in 1997 versus
1996, following an increase of 4.6 percent in 1996 from
1995. Although revenue was essentially flat versus 1996,
operating lease activity grew, but was offset by
lower dealer financing. Gross profit dollars decreased
12.9 percent from 1996, following an increase of
6.6 percent in 1996 from 1995. The decrease was primarily
a result of a trend towards financing a greater volume of
low-end products and faster growth in the more
competitive U.S. market. The increase in 1996 over 1995
was primarily a result of higher margins on operating
leases and lower interest rates. The financing results are
discussed in more detail in note Q, “Global Financing,” on
pages 65 and 66.
management discussion
International Business Machines Corporation
and Subsidiary Companies
42