IBM 1997 Annual Report Download - page 43
Download and view the complete annual report
Please find page 43 of the 1997 IBM annual report below. You can navigate through the pages in the report by either clicking on the pages listed below, or by using the keyword search tool below to find specific information within the annual report.-
 1
1 -
2
-
3
-
4
-
5
-
6
-
7
-
8
-
9
-
10
-
11
-
12
-
13
-
14
-
15
-
16
-
17
-
18
-
19
-
20
-
21
-
22
-
23
-
24
-
25
-
26
-
27
-
28
-
29
-
30
-
31
-
32
-
 33
33 -
 34
34 -
 35
35 -
 36
36 -
 37
37 -
 38
38 -
 39
39 -
 40
40 -
 41
41 -
 42
42 -
 43
43 -
 44
44 -
 45
45 -
 46
46 -
 47
47 -
 48
48 -
 49
49 -
 50
50 -
 51
51 -
 52
52 -
 53
53 -
54
-
55
-
56
-
57
-
58
-
59
-
60
-
61
-
62
-
63
-
64
-
65
-
66
-
67
-
68
-
69
-
70
-
71
-
72
-
73
-
74
-
75
-
76
-
77
-
78
-
79
-
80
-
81
-
82
-
83
-
84
 |
 |

management discussion
International Business Machines Corporation
and Subsidiary Companies
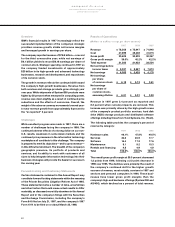
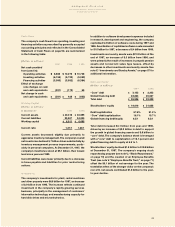
Net earnings per share of common stock were $6.18,
$5.12 and $3.61 in 1997, 1996 and 1995, respectively.
The following information, which is provided for infor-
mational purposes only, excludes the effects of a
$435 million non-tax deductible charge for purchased
in-process research and development in connection with
the Tivoli and Object Technology International, Inc.
acquisitions in March 1996. The 1995 results exclude the
effects of the third quarter charge of $1,840 million for
purchased in-process research and development in
connection with the Lotus Development Company
(Lotus) acquisition.
(Dollars in millions except per share amounts)
1997 1996 1995
Adjusted net
earnings $6,093 $5,864 $6,018
Adjusted net earnings
per share of
common stock $6.18 $5.53 $5.23
Adjusted net earnings
per share of
common stock–
assuming dilution $6.01 $5.41 $5.10
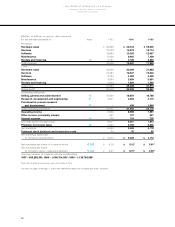
Hardware Sales
Information on revenue by classes of similar products
or services is included in note Y, “Segment Information,”
on page 75. The product trends addressed in this
discussion and in that disclosure are indicative, in all
material respects, of hardware sales activity.
(Dollars in millions)
1997 1996 1995
Revenue $36,229 $36,316 $35,600
Cost 23,538 23,396 21,862
_________________ __________________ __________________
Gross profit $12,691 $12,920 $13,738
Gross profit margin 35.0% 35.6% 38.6%
Revenue from hardware sales was essentially flat (up
about 4 percent in constant currency) from 1996, following
an increase of 2.0 percent in 1996 from 1995. Gross profit
dollars from hardware sales decreased 1.8 percent from
1996, following a decrease of 6.0 percent in 1996 from
1995.
Client revenue was flat versus 1996, following an increase
of 9.8 percent in 1996 over 1995. Although revenue was
flat in 1997, commercial personal computer revenue grew,
as did general-purpose monitors. These increases were
offset by lower revenue associated with consumer
personal computers and RS/6000 products. The 1996
increase over 1995 was driven by higher revenue from
personal computers, especially consumer products,
partially offset by lower revenue from RS/6000.
Revenue from servers decreased 4.5 percent from 1996,
following a decrease of 1.4 percent in 1996 versus 1995.
The 1997 decrease was primarily driven by lower revenue
from System/390, AS/400 and RS/6000 servers. While
System/390 revenue declined, total delivery of mainframe
computing power increased 30 percent as measured in
MIPS (millions of instructions per second) versus last
year. AS/400 and RS/6000 revenue was impacted by a
major product transition during the year, as new models
of these products were announced late in the third quarter
of 1997. These decreases were partially offset by higher
revenue from personal computer servers and large-scale
systems (SP) servers. The decrease in 1996 from 1995
was driven by lower revenue from System/390 servers,
partially offset by higher revenue from AS/400, RS/6000
and personal computer servers.
Storage products revenue decreased 1.9 percent versus
1996, following a decline of 15.9 percent in 1996 from
1995. The declines were driven by lower revenue from
high-end storage products, due to continuing price
competition, partially offset by revenue growth from tape
products.
Original Equipment Manufacturer (OEM) hardware
revenue increased 22.9 percent over 1996, following a
1.3 percent increase in 1996 versus 1995. The 1997
increase resulted from strong growth in HDD storage
products and custom logic products, partially offset by
continuing lower DRAM revenue, due to industry-wide
pricing pressures.
The decrease in the 1997 hardware sales gross profit
dollars was driven by the continued shift in the
company’s mix of revenue to lower gross profit products,
such as personal computers and OEM semiconductors,
partially offset by higher margins for System/390 servers
and storage products. The overall hardware sales margin
continues to be adversely impacted by pricing pressures
across all products.
41