IBM 1997 Annual Report Download - page 67
Download and view the complete annual report
Please find page 67 of the 1997 IBM annual report below. You can navigate through the pages in the report by either clicking on the pages listed below, or by using the keyword search tool below to find specific information within the annual report.-
 1
1 -
2
-
3
-
4
-
5
-
6
-
7
-
8
-
9
-
10
-
11
-
12
-
13
-
14
-
15
-
16
-
17
-
18
-
19
-
20
-
21
-
22
-
23
-
24
-
25
-
26
-
27
-
28
-
29
-
30
-
31
-
32
-
33
-
34
-
35
-
36
-
37
-
38
-
39
-
40
-
41
-
42
-
43
-
44
-
45
-
46
-
47
-
48
-
49
-
50
-
51
-
52
-
53
-
54
-
55
-
56
-
 57
57 -
 58
58 -
 59
59 -
 60
60 -
 61
61 -
 62
62 -
 63
63 -
 64
64 -
 65
65 -
 66
66 -
 67
67 -
 68
68 -
 69
69 -
 70
70 -
 71
71 -
 72
72 -
 73
73 -
 74
74 -
 75
75 -
 76
76 -
 77
77 -
78
-
79
-
80
-
81
-
82
-
83
-
84
 |
 |

notes to consolidated financial statements
International Business Machines Corporation
and Subsidiary Companies
65
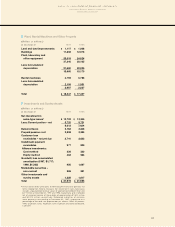
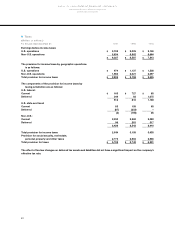
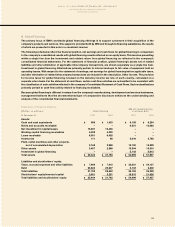
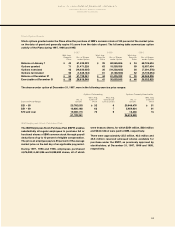
Q Global Financing
The primary focus of IBM’s worldwide global financing offerings is to support customers in their acquisition of the
company’s products and services. This support is provided both by IBM and through its financing subsidiaries, the results
of which are presented in this note in a consistent manner.
The following schedules reflect the financial position, net earnings and cash flows for global financing in comparison
to the company’s consolidated results with global financing results reflected on an equity basis. This involves presenting
within a single line item the investment and related return from global financing as reflected in the company’s
consolidated financial statements. For the statement of financial position, global financing’s assets net of related
liabilities and after elimination of applicable intracompany transactions, are shown separately as a single line item,
Investment in global financing. Eliminations primarily pertain to internal markups to fair value of equipment held on
operating leases. With respect to the statement of earnings, net earnings for global financing before applicable taxes,
and after elimination of related intracompany transactions are included in the description, Other income. The provision
for income taxes for global financing is based on the statutory income tax rate of each country, calculated on a
separate return basis. For the statement of cash flows, certain cash flow activities are reclassified to be consistent with
the classification of such activities reflected in the company’s Consolidated Statement of Cash Flows. Such reclassifications
primarily pertain to cash flow activity related to financing receivables.
Because global financing is different in nature from the company’s manufacturing, development and services businesses,
management believes that the aforementioned type of comparative disclosure enhances the understanding and
analysis of the consolidated financial statements.
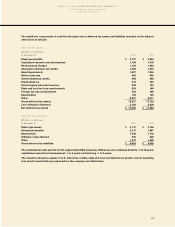
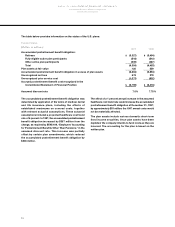
Statement of Financial Position
IBM with Global Financing
(Dollars in millions) Global Financing on an Equity Basis
At December 31: 1997 1996 1997 1996
Assets:
Cash and cash equivalents $998 $1,433 $6,108 $6,254
Notes and accounts receivable – – 9,551 10,063
Net investment in capital leases 13,831 13,430 – –
Working capital financing receivables 4,928 4,030 – –
Loans receivable 6,951 6,428 – –
Inventories 111 98 5,044 5,788
Plant, rental machines and other property,
net of accumulated depreciation 5,168 3,988 15,790 15,229
Other assets 3,457 2,386 13,364 15,010
Investment in global financing – – 5,142 5,613
_________________ _________________ _________________ _________________
Total assets $35,444 $31,793 $54,999 $57,957
Liabilities and stockholders’ equity:
Taxes, accrued expenses and other liabilities $7,969 $7,915 $32,081 $34,127
Debt 23,824 20,627 3,102 2,202
_________________ _________________ _________________ _________________
Total liabilities 31,793 28,542 35,183 36,329
Stockholders’ equity/invested capital 3,651 3,251 19,816 21,628
_________________ _________________ _________________ _________________
Total liabilities and stockholders’ equity $35,444 $31,793 $54,999 $57,957