IBM 1997 Annual Report Download - page 47
Download and view the complete annual report
Please find page 47 of the 1997 IBM annual report below. You can navigate through the pages in the report by either clicking on the pages listed below, or by using the keyword search tool below to find specific information within the annual report.-
 1
1 -
2
-
3
-
4
-
5
-
6
-
7
-
8
-
9
-
10
-
11
-
12
-
13
-
14
-
15
-
16
-
17
-
18
-
19
-
20
-
21
-
22
-
23
-
24
-
25
-
26
-
27
-
28
-
29
-
30
-
31
-
32
-
33
-
34
-
35
-
36
-
 37
37 -
 38
38 -
 39
39 -
 40
40 -
 41
41 -
 42
42 -
 43
43 -
 44
44 -
 45
45 -
 46
46 -
 47
47 -
 48
48 -
 49
49 -
 50
50 -
 51
51 -
 52
52 -
 53
53 -
 54
54 -
 55
55 -
 56
56 -
 57
57 -
58
-
59
-
60
-
61
-
62
-
63
-
64
-
65
-
66
-
67
-
68
-
69
-
70
-
71
-
72
-
73
-
74
-
75
-
76
-
77
-
78
-
79
-
80
-
81
-
82
-
83
-
84
 |
 |

management discussion
International Business Machines Corporation
and Subsidiary Companies
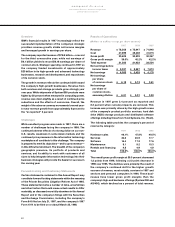
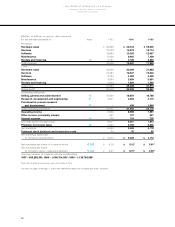
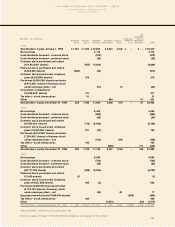
Cash Flows
The company’s cash flows from operating, investing and
financing activities as prescribed by generally accepted
accounting principles and reflected in the Consolidated
Statement of Cash Flows on page 52, are summarized
in the following table:
(Dollars in millions)
1997 1996 1995
Net cash provided
from (used in):
Operating activities $ 8,865 $ 10,275 $ 10,708
Investing activities (6,155) (5,723) (5,052)
Financing activities (3,090) (3,952) (6,384)
Effect of exchange
rate changes on cash
and cash equivalents (201) (172) 65
_________________ _________________ _________________
Net change in cash
and cash equivalents $(581) $428 $(663)
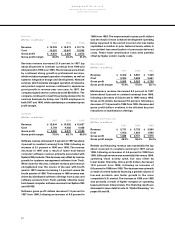
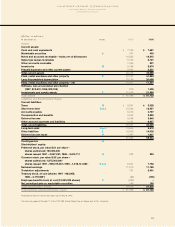
Working Capital
(Dollars in millions)
At December 31: 1997 1996
Current assets $40,418 $40,695
Current liabilities 33,507 34,000
_________________ _________________
Working capital $6,911 $6,695
Current ratio 1.21:1 1.20:1
Current assets decreased slightly due primarily to
aggressive inventory management. The company’s overall
net inventories declined $.7 billion driven substantially by
inventory management process improvements, partic-
ularly in personal computers. At December 31, 1997, the
company’s inventories stood at $5.1 billion, their lowest
level since year-end 1983.
Current liabilities were lower primarily due to a decrease
in taxes payable and liabilities for prior restructuring
actions.
Investments
The company’s investments for plant, rental machines
and other property were $6.8 billion for 1997, an increase
of $.9 billion from 1996. The increase reflects continued
investment in the company’s rapidly growing services
business, principally in the management of customers’
information technology, and manufacturing capacity for
hard disk drives and microelectronics.
In addition to software development expenses included
in research, development and engineering, the company
capitalized $.3 billion of software costs during 1997 and
1996. Amortization of capitalized software costs amounted
to $1.0 billion for 1997, a decrease of $.4 billion from 1996.
Investments and sundry assets were $21.9 billion at the
end of 1997, an increase of $.3 billion from 1996, and
were primarily the result of increases in prepaid pension
assets and noncurrent sales type leases, offset by
decreases in other investments and sundry assets. See
note F, “Investments and Sundry Assets,” on page 57 for
additional information.
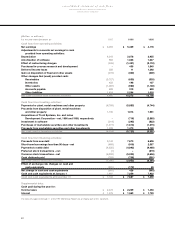
Debt and Equity
(Dollars in millions)
1997 1996
“Core” debt $3,102 $2,202
Global financing debt 23,824 20,627
__________________ ___________________
Total debt $26,926 $22,829
Stockholders’ equity $19,816 $21,628
Debt/capitalization 57.6% 51.4%
“Core” debt/capitalization 16.1% 10.7%
Global financing debt/equity 6.5:1 6.3:1
Total debt increased $4.1 billion from year-end 1996,
driven by an increase of $3.2 billion in debt to support
the growth in global financing assets and $.9 billion in
“core” debt. The company’s balance sheet is leveraged
with a “core” debt to capitalization of 16.1 percent and
global financing debt to equity at 6.5 to 1.
Stockholders’ equity declined $1.8 billion to $19.8 billion
at December 31, 1997. The company’s ongoing stock
repurchasing program (see note U, “Stock Repurchases,”
on page 70) and the creation of an Employee Benefits
Trust (see note V, “Employee Benefits Trust,” on page 71)
offset the $6.1 billion of net earnings for the year. The
translation effect of the stronger dollar on the company’s
non-U.S. net assets contributed $1.6 billion to the year-
to-year decline.
45