IBM 1997 Annual Report Download - page 42
Download and view the complete annual report
Please find page 42 of the 1997 IBM annual report below. You can navigate through the pages in the report by either clicking on the pages listed below, or by using the keyword search tool below to find specific information within the annual report.-
 1
1 -
2
-
3
-
4
-
5
-
6
-
7
-
8
-
9
-
10
-
11
-
12
-
13
-
14
-
15
-
16
-
17
-
18
-
19
-
20
-
21
-
22
-
23
-
24
-
25
-
26
-
27
-
28
-
29
-
30
-
31
-
 32
32 -
 33
33 -
 34
34 -
 35
35 -
 36
36 -
 37
37 -
 38
38 -
 39
39 -
 40
40 -
 41
41 -
 42
42 -
 43
43 -
 44
44 -
 45
45 -
 46
46 -
 47
47 -
 48
48 -
 49
49 -
 50
50 -
 51
51 -
 52
52 -
53
-
54
-
55
-
56
-
57
-
58
-
59
-
60
-
61
-
62
-
63
-
64
-
65
-
66
-
67
-
68
-
69
-
70
-
71
-
72
-
73
-
74
-
75
-
76
-
77
-
78
-
79
-
80
-
81
-
82
-
83
-
84
 |
 |

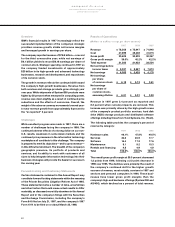
Overview
IBM’s financial results in 1997 increasingly reflect the
successful implementation of the company’s strategic
priorities: revenue growth, stable net income margins
and leveraged growth in earnings per share.
The company reported revenue of $78.5 billion— a record
for the third consecutive year; while net earnings of
$6.1 billion yielded a record $6.18 earnings per share of
common stock. Strategic spending continued in 1997 as
the company funded investments of approximately
$20 billion in its high-growth and advanced technology
businesses, research and development, and repurchases
of its common stock.
The growth in revenue reflects the continued shift toward
the company’s high-growth businesses. Revenue from
both services and storage products grew strongly year
over year. While shipments of System/390 products were
higher by 30 percent when measured in computing power,
revenue was down slightly as a result of continued price
reductions and the effects of currencies. Overall, the
weight of the adverse currency movements lowered year-
to-year revenue growth from approximately 8 percent to
the “as reported” 3 percent.
Challenges
While excellent progress was made in 1997, there are a
number of challenges facing the company in 1998. The
continued adverse effects of a strong dollar on our non-
U.S. results, weakness in some Asian markets and the
continued price pressures in the information technology
marketplace all contribute to this challenge. The company
is prepared to meet its objectives— and to grow revenue—
in this difficult environment. The breadth of the company’s
geographic presence, its portfolio of products and
services, and its ability to work with customers of all
sizes to help integrate information technology into their
business strategies will provide the basis for success in
the coming year.
Forward-looking and Cautionary Statements
Certain statements contained in this Annual Report may
constitute forward-looking statements within the meaning
of the Private Securities Litigation Reform Act of 1995.
These statements involve a number of risks, uncertainties
and other factors that could cause actual results to differ
materially, as discussed more fully elsewhere in this Annual
Report and in the company’s filings with the Securities
and Exchange Commission, including the company’s
Form 8-K filed on July 21, 1997, and the company’s 1997
Form 10-K to be filed on or about March 23, 1998.
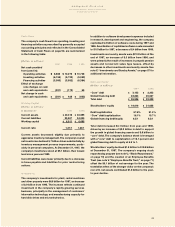
Results of Operations
(Dollars in millions except per share amounts)
1997 1996 1995
Revenue $78,508 $75,947 $71,940
Cost 47,899 45,408 41,573
_________________ __________________ __________________
Gross profit 30,609 30,539 30,367
Gross profit margin 39.0% 40.2% 42.2%
Total expense 21,582 21,952 22,554
_________________ __________________ __________________
Net earnings before
income taxes $9,027 $8,587 $7,813
Net earnings $6,093 $5,429 $4,178
Net earnings
per share
of common stock $6.18 $5.12 $3.61
Net earnings
per share of
common stock–
assuming dilution $6.01 $5.01 $3.53
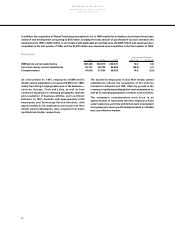
Revenue in 1997 grew 3.4 percent as reported and
8.3 percent when currency impacts are removed. This
increase was primarily driven by the high-growth areas
of the company’s product portfolio: services, hard disk
drive (HDD) storage products and distributed software
offerings including those from Tivoli Systems, Inc. (Tivoli).
The following table provides the company’s percent of
revenue by category:
1997 1996 1995
Hardware sales 46.1% 47.8% 49.5%
Services 24.6 20.9 17.7
Software 16.4 17.2 17.6
Maintenance 8.1 9.2 10.3
Rentals and financing 4.8 4.9 4.9
___________ ___________ ___________
Total 100.0% 100.0% 100.0%
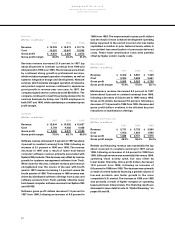
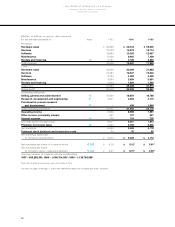
The overall gross profit margin at 39.0 percent decreased
1.2 points from 1996, following a 2.0 point decrease in
1996 over 1995. The declines were primarily the result of
the company’s continued shift to the higher growth
sources of revenue, most notably, services in 1997 and
services and personal computers in 1996. These busi-
nesses have lower gross profit margins than the
company’s high-end hardware offerings (System/390 and
AS/400), which declined as a percent of total revenue.
management discussion
International Business Machines Corporation
and Subsidiary Companies
40