Holiday Inn 2006 Annual Report Download - page 97
Download and view the complete annual report
Please find page 97 of the 2006 Holiday Inn annual report below. You can navigate through the pages in the report by either clicking on the pages listed below, or by using the keyword search tool below to find specific information within the annual report.-
 1
1 -
2
-
3
-
4
-
5
-
6
-
7
-
8
-
9
-
10
-
11
-
12
-
13
-
14
-
15
-
16
-
17
-
18
-
19
-
20
-
21
-
22
-
23
-
24
-
25
-
26
-
27
-
28
-
29
-
30
-
31
-
32
-
33
-
34
-
35
-
36
-
37
-
38
-
39
-
40
-
41
-
42
-
43
-
44
-
45
-
46
-
47
-
48
-
49
-
50
-
51
-
52
-
53
-
54
-
55
-
56
-
57
-
58
-
59
-
60
-
61
-
62
-
63
-
64
-
65
-
66
-
67
-
68
-
69
-
70
-
71
-
72
-
73
-
74
-
75
-
76
-
77
-
78
-
79
-
80
-
81
-
82
-
83
-
84
-
85
-
86
-
 87
87 -
 88
88 -
 89
89 -
 90
90 -
 91
91 -
 92
92 -
 93
93 -
 94
94 -
 95
95 -
 96
96 -
 97
97 -
 98
98 -
 99
99 -
 100
100
 |
 |

Shareholder profiles
IHG Useful information 95
Percentage of Percentage
Number of total Ordinary of issued
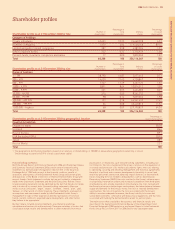
Shareholder profile as at 31 December 2006 by type shareholders shareholders shares share capital
Category of holdings
Private individuals 63,603 93.25 24,660,398 6.92
Nominee companies 3,979 5.84 319,528,768 89.74
Limited and public limited companies 387 0.58 4,389,904 1.23
Other corporate bodies 222 0.33 3,716,939 1.04
Pension funds, insurance companies and banks 17 0.00 3,820,040 1.07
Total 68,208 100 356,116,049 100
Percentage of Percentage
Number of total Ordinary of issued
Shareholder profile as at 31 December 2006 by size shareholders shareholders shares share capital
Range of holdings
1 – 199 38,790 56.87 2,617,445 0.73
200 – 499 14,620 21.43 4,728,867 1.33
500 – 999 7,767 11.39 5,457,123 1.53
1,000 – 4,999 5,891 8.64 10,874,513 3.05
5,000 – 9,999 361 0.53 2,464,002 0.69
10,000 – 49,999 375 0.55 8,361,792 2.35
50,000 – 99,999 98 0.14 7,039,036 1.98
100,000 – 499,999 192 0.28 44,941,630 12.62
500,000 – 999,999 56 0.08 40,440,812 11.36
1,000,000 – highest 58 0.09 229,190,829 64.36
Total 68,208 100 356,116,049 100
Percentage of
Shareholder profile as at 31 December 2006 by geographical location issued share capital1
Country/Jurisdiction
England & Wales 58.28
Scotland 8.66
Rest of Europe 8.91
USA (including ADRs) 20.95
Japan 0.89
Rest of World 2.31
Total 100
1 The geographical distribution presented is based on an analysis of shareholdings of 150,000 or above where geographical ownership is known.
These holdings account for 82.19% of total issued share capital.
Glossary and Shareholder profiles and forward-looking statements
Forward-looking statements
Both the Annual Report and Financial Statements 2006 and the Annual Review
and Summary Financial Statement 2006 contain certain forward-looking
statements as defined under US legislation (Section 21E of the Securities
Exchange Act of 1934) with respect to the financial condition, results of
operations and business of InterContinental Hotels Group and certain plans
and objectives of the Board of Directors of InterContinental Hotels Group with
respect thereto. Such statements include, but are not limited to, statements
made in the Chairman’s Statement and the Chief Executive’s Review. These
forward-looking statements can be identified by the fact that they do not relate
only to historical or current facts. Forward-looking statements often use
words such as ‘anticipate’, ‘target’, ‘expect’, ‘estimate’, ‘intend’, ‘plan’, ‘goal’,
‘believe’, or other words of similar meaning. These statements are based on
assumptions and assessments made by InterContinental Hotels Group’s
management in light of their experience and their perception of historical
trends, current conditions, expected future developments and other factors
they believe to be appropriate.
By their nature, forward-looking statements are inherently predictive,
speculative and involve risk and uncertainty. There are a number of factors that
could cause actual results and developments to differ materially from those
expressed in, or implied by, such forward-looking statements, including, but
not limited to: the risks involved with the Group’s reliance on the reputation of
its brands and protection of its intellectual property rights; the risks relating
to identifying, securing and retaining management and franchise agreements;
the effect of political and economic developments; the ability to recruit and
retain key personnel; events that adversely impact domestic or international
travel, including terrorist incidents and epidemics such as Severe Acute
Respiratory Syndrome (SARS); the risks involved in the Group’s reliance upon
its proprietary reservation system and increased competition from third-party
intermediaries who provide reservation infrastructure; the risks involved with
the Group’s reliance on technologies and systems; the future balance between
supply and demand for the Group’s hotels; the lack of selected development
opportunities; the risk of litigation; the risks associated with the Group’s
ability to maintain adequate insurance; the Group’s ability to borrow and
satisfy debt covenants; compliance with data privacy regulations; and the risks
associated with funding the defined benefits under its pension plans.
The main factors that could affect the business and financial results are
described in the Operating and Financial Review of the Annual Report and
Financial Statements 2006 and also in any Annual Report of InterContinental
Hotels Group PLC on Form 20-F for 2006 and for any subsequent year.