Holiday Inn 2006 Annual Report Download - page 13
Download and view the complete annual report
Please find page 13 of the 2006 Holiday Inn annual report below. You can navigate through the pages in the report by either clicking on the pages listed below, or by using the keyword search tool below to find specific information within the annual report.-
 1
1 -
2
-
 3
3 -
 4
4 -
 5
5 -
 6
6 -
 7
7 -
 8
8 -
 9
9 -
 10
10 -
 11
11 -
 12
12 -
 13
13 -
 14
14 -
 15
15 -
 16
16 -
 17
17 -
 18
18 -
 19
19 -
 20
20 -
 21
21 -
 22
22 -
 23
23 -
24
-
25
-
26
-
27
-
28
-
29
-
30
-
31
-
32
-
33
-
34
-
35
-
36
-
37
-
38
-
39
-
40
-
41
-
42
-
43
-
44
-
45
-
46
-
47
-
48
-
49
-
50
-
51
-
52
-
53
-
54
-
55
-
56
-
57
-
58
-
59
-
60
-
61
-
62
-
63
-
64
-
65
-
66
-
67
-
68
-
69
-
70
-
71
-
72
-
73
-
74
-
75
-
76
-
77
-
78
-
79
-
80
-
81
-
82
-
83
-
84
-
85
-
86
-
87
-
88
-
89
-
90
-
91
-
92
-
93
-
94
-
95
-
96
-
97
-
98
-
99
-
100
 |
 |

IHG Operating and financial review 11
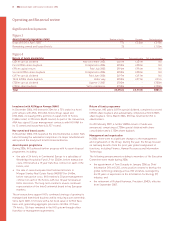
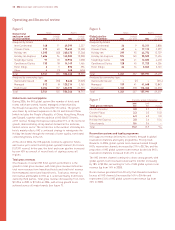
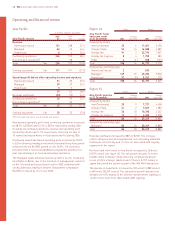
The Americas
12 months ended 31 December
2006 2005 %
Americas results $m $m change
Revenue:
Owned and leased 211 195 8.2
Managed 143 118 21.2
Franchised 443 389 13.9
Continuing operations 797 702 13.5
Discontinued operations* 55 111 (50.5)
Total $m 852 813 4.8
Sterling equivalent £m 463 445 4.0
Operating profit before other operating income and expenses:
Owned and leased 26 25 4.0
Managed 50 36 38.9
Franchised 382 340 12.4
458 401 14.2
Regional overheads (59) (62) (4.8)
Continuing operations 399 339 17.7
Discontinued operations* 823 (65.2)
Total $m 407 362 12.4
Sterling equivalent £m 221 198 11.6
*Discontinued operations are all owned and leased.
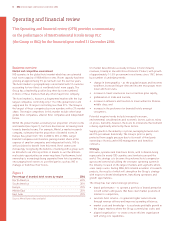
Revenue and operating profit from continuing operations increased
by 13.5% to $797m and 17.7% to $399m respectively during 2006.
Underlying trading performance across all ownership types was
strong, although the pace of RevPAR growth achieved in the first
half of the year was not maintained throughout the second
half of the year.
Discontinued operations include the results of hotels sold
during 2005 and 2006, together with four hotels currently on the
market for disposal. Including discontinued operations, revenue
grew 4.8% whilst operating profit increased by 12.4%.
Continuing owned and leased revenue increased by 8.2% to $211m.
Owned and leased InterContinental branded hotels achieved RevPAR
growth in excess of 12% over 2005, driven by gains in both daily
rates and occupancy levels (see figure 8). The owned and leased
results were impacted, as expected, by a $6m loss at the recently
opened InterContinental Boston. Excluding this loss, the combined
impact of RevPAR growth and operating efficiencies led to a 28%
increase in operating profit from continuing owned and leased hotels.
Operating and financial review
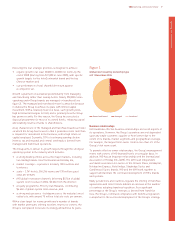
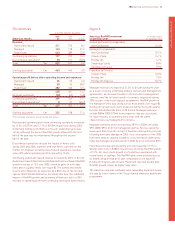
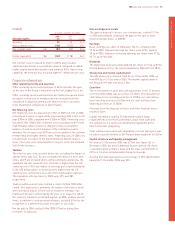
Figure 8
Americas RevPAR movement 12 months ended
on previous year 31 December 2006
Owned and leased (comparable):
InterContinental 12.2%
Managed (comparable):
InterContinental 10.1%
Crowne Plaza 14.1%
Holiday Inn 4.7%
Staybridge Suites 8.8%
Candlewood Suites 9.9%
Franchise (all hotels):
Crowne Plaza 10.3%
Holiday Inn 7.6%
Holiday Inn Express 10.7%
Managed revenues increased by 21.2% to $143m during the year
as a result of strong underlying trading, restructured management
agreements, an increased number of hotels under management
contracts and the full year benefit of contracts negotiated during
2005 as part of the hotel disposal programme. RevPAR growth in
the managed hotels was strong across most brands (see figure 8).
Holiday Inn growth levels were impacted during the fourth quarter
by hotel refurbishments (nine of 28 hotels). Managed revenues
include $80m (2005 $70m) from properties that are structured,
for legal reasons, as operating leases but with the same
characteristics as management contracts.
Managed operating profit increased by 38.9% to $50m including
$9m (2005 $9m) from the managed properties held as operating
leases and $3m from the receipt of business interruption proceeds
following hurricane damage in 2005. As a consequence of the 2005
hurricane season, ongoing insurance costs increased significantly,
reducing managed operating profit in 2006 by an incremental $3m.
Franchised revenue and operating profit increased by 13.9% to
$443m and 12.4% to $382m respectively, driven by RevPAR growth
of 9.2%, net room count growth of 4% and fees associated with
record levels of signings. The RevPAR gains were achieved across
all brands despite high prior year comparables (see figure 8).
Holiday Inn Express and Crowne Plaza both reported double digit
RevPAR growth, driven by higher daily rates.
The Americas regional overheads were favourably impacted during
the year by lower claims in the Group-funded employee healthcare
programme.