Holiday Inn 2006 Annual Report Download - page 11
Download and view the complete annual report
Please find page 11 of the 2006 Holiday Inn annual report below. You can navigate through the pages in the report by either clicking on the pages listed below, or by using the keyword search tool below to find specific information within the annual report.-
 1
1 -
 2
2 -
 3
3 -
 4
4 -
 5
5 -
 6
6 -
 7
7 -
 8
8 -
 9
9 -
 10
10 -
 11
11 -
 12
12 -
 13
13 -
 14
14 -
 15
15 -
 16
16 -
 17
17 -
 18
18 -
 19
19 -
 20
20 -
 21
21 -
 22
22 -
23
-
24
-
25
-
26
-
27
-
28
-
29
-
30
-
31
-
32
-
33
-
34
-
35
-
36
-
37
-
38
-
39
-
40
-
41
-
42
-
43
-
44
-
45
-
46
-
47
-
48
-
49
-
50
-
51
-
52
-
53
-
54
-
55
-
56
-
57
-
58
-
59
-
60
-
61
-
62
-
63
-
64
-
65
-
66
-
67
-
68
-
69
-
70
-
71
-
72
-
73
-
74
-
75
-
76
-
77
-
78
-
79
-
80
-
81
-
82
-
83
-
84
-
85
-
86
-
87
-
88
-
89
-
90
-
91
-
92
-
93
-
94
-
95
-
96
-
97
-
98
-
99
-
100
 |
 |

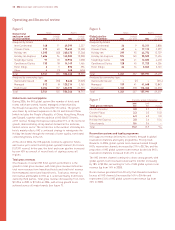
IHG Operating and financial review 9
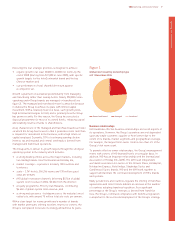
Key performance indicators (KPIs)
In addition to the traditional profit measures, the management
team at IHG monitor the Group and regional performance of the
business through a range of financial and non-financial KPIs, the
most significant of which include:
• total gross revenue – measure of the scale and reach
of IHG’s brands;
• revenue per available room (RevPAR) – measure of underlying
hotel revenue with year-on-year performance being measured
by the RevPAR movement against the prior year;
• hotel and room count – measure of the size of IHG’s portfolio;
and
• pipeline of hotels and rooms – measure of demand and growth
potential for IHG’s brands.
Data for the calculation of KPIs is provided from IHG and
underlying hotel records.
The following section assesses IHG’s KPIs in conjunction with
the Group and regional trading performance. KPI definitions are
included in the Glossary.
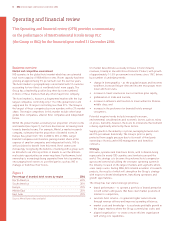
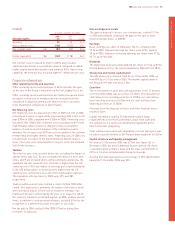
Group results
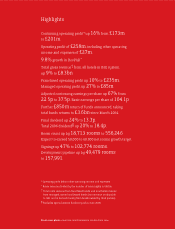
Revenue from continuing operations increased by 12.9% to £805m
and continuing operating profit increased by 16.2% to £201m during
the 12 months ended 31 December 2006. The growth was driven by
a combination of strong industry fundamentals in all three of IHG’s
regions, RevPAR premiums to market for most of IHG’s brands and
continuing expansion in hotel and room count.
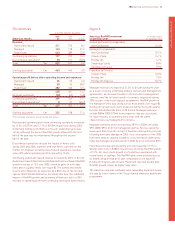
Including discontinued operations, total operating profit before other
operating income and expenses decreased by 31.9% to £231m
during 2006 as a result of asset disposals. Discontinued operations
represent the results from operations that have been sold or are
held for sale and where there is a co-ordinated plan to dispose of
the operations under IHG’s asset disposal programme. In this OFR,
discontinued operations include owned and leased hotels in the US,
UK, Continental Europe and Asia Pacific that have been sold or
placed on the market from 1 January 2005, and the Britvic Group,
disposed of by way of an initial public offering in December 2005.
With the weighted average US dollar exchange rate to sterling
being similar to the rate in 2005 (2006 $1.84: £1, 2005 $1.83: £1),
growth rates for results expressed in US dollars were similar to
those in sterling. Continuing operating profit before other operating
income and expenses was $369m, ahead of 2005 by 16.8%.
Including discontinued operations, operating profit before other
income and expenses was $424m, 31.5% lower than 2005.
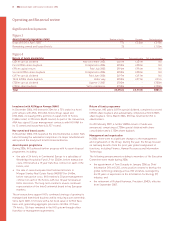
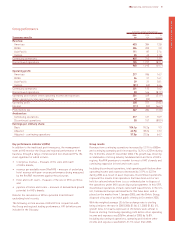
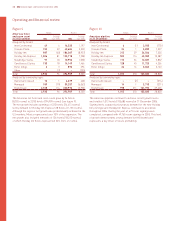
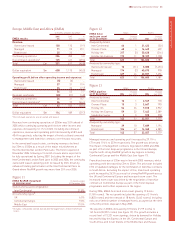
Operating and financial review
Group performance
12 months ended 31 December
2006 2005 %
Summary results £m £m change
Revenue:
Americas 433 384 12.8
EMEA 206 200 3.0
Asia Pacific 111 87 27.6
Central 55 42 31.0
Continuing operations 805 713 12.9
Discontinued operations 155 1,197 (87.1)
960 1,910 (49.7)
Operating profit:
Americas 217 186 16.7
EMEA 36 31 16.1
Asia Pacific 29 21 38.1
Central (81) (65) 24.6
Continuing operations 201 173 16.2
Discontinued operations 30 166 (81.9)
Operating profit before other operating income and expenses 231 339 (31.9)
Other operating income and expenses 27 (22) –
Operating profit 258 317 (18.6)
Interest (11) (33) (66.7)
Profit before tax 247 284 (13.0)
Analysed as:
Continuing operations 217 127 70.9
Discontinued operations 30 157 (80.9)
Earnings per ordinary share:
Basic 104.1p 95.2p 9.3
Adjusted 42.9p 38.2p 12.3
Adjusted – continuing operations 37.5p 22.5p 66.7