Holiday Inn 2006 Annual Report Download - page 76
Download and view the complete annual report
Please find page 76 of the 2006 Holiday Inn annual report below. You can navigate through the pages in the report by either clicking on the pages listed below, or by using the keyword search tool below to find specific information within the annual report.-
 1
1 -
2
-
3
-
4
-
5
-
6
-
7
-
8
-
9
-
10
-
11
-
12
-
13
-
14
-
15
-
16
-
17
-
18
-
19
-
20
-
21
-
22
-
23
-
24
-
25
-
26
-
27
-
28
-
29
-
30
-
31
-
32
-
33
-
34
-
35
-
36
-
37
-
38
-
39
-
40
-
41
-
42
-
43
-
44
-
45
-
46
-
47
-
48
-
49
-
50
-
51
-
52
-
53
-
54
-
55
-
56
-
57
-
58
-
59
-
60
-
61
-
62
-
63
-
64
-
65
-
 66
66 -
 67
67 -
 68
68 -
 69
69 -
 70
70 -
 71
71 -
 72
72 -
 73
73 -
 74
74 -
 75
75 -
 76
76 -
 77
77 -
 78
78 -
 79
79 -
 80
80 -
 81
81 -
 82
82 -
 83
83 -
 84
84 -
 85
85 -
 86
86 -
87
-
88
-
89
-
90
-
91
-
92
-
93
-
94
-
95
-
96
-
97
-
98
-
99
-
100
 |
 |

Notes to the Group financial statements
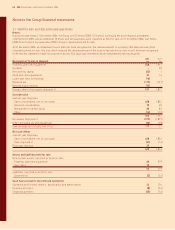
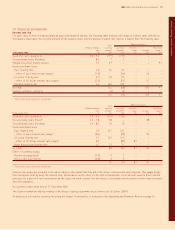
23 Employee benefits (continued)
Pension plans Post-employment
UK US benefits Total
2006 2005 2006 2005 2006 2005 2006 2005
Movement in benefit obligation £m £m £m £m £m £m £m £m
Benefit obligation at beginning of year 274 600 103 88 11 11 388 699
Current service cost 519 ––––519
Members’ contributions 12––––12
Interest expense 13 30 561119 37
Benefits paid (7) (11) (6) (6) (1) (1) (14) (18)
Plan curtailment –(7) –––––(7)
Actuarial loss/(gain) arising in the year 12 67 –3(1) (1) 11 69
Separation of Soft Drinks –(426) –––––(426)
Exchange adjustments ––(13) 12 (1) 1(14) 13
Benefit obligation at end of year 298 274 89 103 911 396 388
The defined benefit obligation comprises £340m (2005 £328m) arising from plans that are wholly or partly funded and £56m (2005 £60m)
arising from unfunded plans.
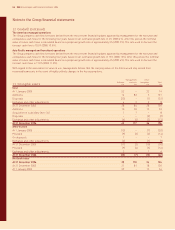
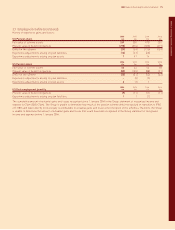
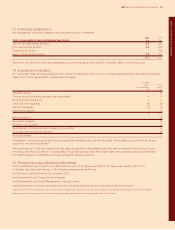
The combined assets of the principal schemes and expected rate of return were:
2006 2005
Long-term Long-term
rate of rate of
return return
expected Value expected Value
UK Schemes %£m %£m
Equities 7.9 128 7.5 125
Bonds 4.6 123 4.2 110
Other 7.9 18 7.5 15
Total market value of assets 269 250
US Schemes
Equities 9.5 34 9.6 38
Fixed income 5.5 22 5.5 24
Total market value of assets 56 62
The expected rate of return on assets has been determined following advice from the plans’ independent actuaries and is based on the
expected return on each asset class together with consideration of the long-term asset strategy.
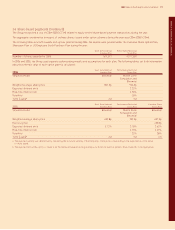
Pension plans Post-employment
UK US benefits Total
2006 2005 2006 2005 2006 2005 2006 2005
Movement in plan assets £m £m £m £m £m £m £m £m
Fair value of plan assets at beginning of year 250 470 62 56 ––312 526
Company contributions 445 1211648
Members’ contributions 12––––12
Benefits paid (7) (11) (6) (6) (1) (1) (14) (18)
Expected return on assets 14 32 45––18 37
Actuarial gain/(loss) arising in the year 747 2(1) ––946
Separation of Soft Drinks –(335) –––––(335)
Exchange adjustments ––(7) 6––(7) 6
Fair value of plan assets at end of year 269 250 56 62 ––325 312
Normal company contributions are expected to be £7m in 2007. In addition, the Group has agreed to pay special contributions of £40m to the
UK Pension Plan; £20m in 2007, £10m in 2008 and £10m in 2009.
74 IHG Annual report and financial statements 2006