Holiday Inn 2006 Annual Report Download - page 59
Download and view the complete annual report
Please find page 59 of the 2006 Holiday Inn annual report below. You can navigate through the pages in the report by either clicking on the pages listed below, or by using the keyword search tool below to find specific information within the annual report.-
 1
1 -
2
-
3
-
4
-
5
-
6
-
7
-
8
-
9
-
10
-
11
-
12
-
13
-
14
-
15
-
16
-
17
-
18
-
19
-
20
-
21
-
22
-
23
-
24
-
25
-
26
-
27
-
28
-
29
-
30
-
31
-
32
-
33
-
34
-
35
-
36
-
37
-
38
-
39
-
40
-
41
-
42
-
43
-
44
-
45
-
46
-
47
-
48
-
 49
49 -
 50
50 -
 51
51 -
 52
52 -
 53
53 -
 54
54 -
 55
55 -
 56
56 -
 57
57 -
 58
58 -
 59
59 -
 60
60 -
 61
61 -
 62
62 -
 63
63 -
 64
64 -
 65
65 -
 66
66 -
 67
67 -
 68
68 -
 69
69 -
70
-
71
-
72
-
73
-
74
-
75
-
76
-
77
-
78
-
79
-
80
-
81
-
82
-
83
-
84
-
85
-
86
-
87
-
88
-
89
-
90
-
91
-
92
-
93
-
94
-
95
-
96
-
97
-
98
-
99
-
100
 |
 |

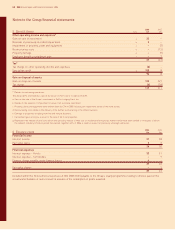
Notes to the Group financial statements
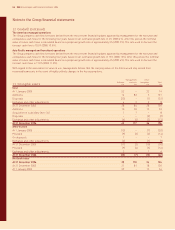
2 Segmental information (continued)
Year ended 31 December 2005*
Americas EMEA Asia Pacific Central Total Hotels
Revenue £m £m £m £m £m
Hotels
Owned and leased 106 110 59 – 275
Managed 65 55 25 – 145
Franchised 213 35 3 – 251
Central –––4242
Continuing operations 384 200 87 42 713
Discontinued operations – owned and leased 61 411 54 – 526
445 611 141 42 1,239
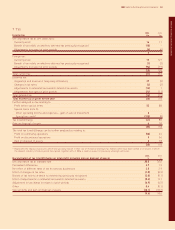
Continuing Discontinued Group
£m £m £m
Group
Hotels 713 526 1,239
Soft Drinks – 671 671
Total revenue 713 1,197 1,910
Americas EMEA Asia Pacific Central Total Hotels
Segmental result £m £m £m £m £m
Hotels
Owned and leased 14 (5) 11 – 20
Managed 20 31 16 – 67
Franchised 186 26 2 – 214
Regional and central (34) (21) (8) (65) (128)
Continuing operations 186 31 21 (65) 173
Discontinued operations – owned and leased 12 73 11 – 96
198 104 32 (65) 269
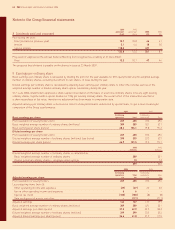
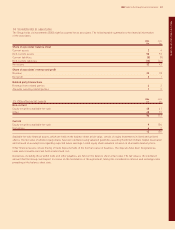
Continuing Discontinued Group
£m £m £m
Group
Hotels 173 96 269
Soft Drinks –7070
173 166 339
Other operating income and expenses (22) – (22)
Operating profit 151 166 317
Net finance costs (24) (9) (33)
Profit before tax 127 157 284
Tax (24) (56) (80)
Profit after tax 103 101 204
Gain on disposal of assets, net of tax – 311 311
Profit for the year 103 412 515
* Other than for Soft Drinks which reflects the 50 weeks and three days ended 14 December.
IHG Notes to the Group financial statements 57