Holiday Inn 2006 Annual Report Download - page 16
Download and view the complete annual report
Please find page 16 of the 2006 Holiday Inn annual report below. You can navigate through the pages in the report by either clicking on the pages listed below, or by using the keyword search tool below to find specific information within the annual report.-
 1
1 -
2
-
3
-
4
-
5
-
 6
6 -
 7
7 -
 8
8 -
 9
9 -
 10
10 -
 11
11 -
 12
12 -
 13
13 -
 14
14 -
 15
15 -
 16
16 -
 17
17 -
 18
18 -
 19
19 -
 20
20 -
 21
21 -
 22
22 -
 23
23 -
 24
24 -
 25
25 -
 26
26 -
27
-
28
-
29
-
30
-
31
-
32
-
33
-
34
-
35
-
36
-
37
-
38
-
39
-
40
-
41
-
42
-
43
-
44
-
45
-
46
-
47
-
48
-
49
-
50
-
51
-
52
-
53
-
54
-
55
-
56
-
57
-
58
-
59
-
60
-
61
-
62
-
63
-
64
-
65
-
66
-
67
-
68
-
69
-
70
-
71
-
72
-
73
-
74
-
75
-
76
-
77
-
78
-
79
-
80
-
81
-
82
-
83
-
84
-
85
-
86
-
87
-
88
-
89
-
90
-
91
-
92
-
93
-
94
-
95
-
96
-
97
-
98
-
99
-
100
 |
 |

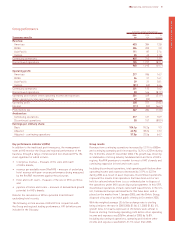
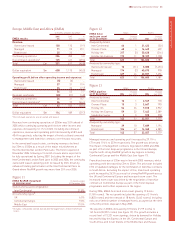
Asia Pacific
12 months ended 31 December
2006 2005 %
Asia Pacific results $m $m change
Revenue:
Owned and leased 131 108 21.3
Managed 65 45 44.4
Franchised 86 33.3
Continuing operations 204 159 28.3
Discontinued operations* –98 –
Total $m 204 257 (20.6)
Sterling equivalent £m 111 141 (21.3)
Operating profit before other operating income and expenses:
Owned and leased 31 20 55.0
Managed 39 29 34.5
Franchised 55–
75 54 38.9
Regional overheads (23) (15) 53.3
Continuing operations 52 39 33.3
Discontinued operations* –20 –
Total $m 52 59 (11.9)
Sterling equivalent £m 29 32 (9.4)
*Discontinued operations are all owned and leased.
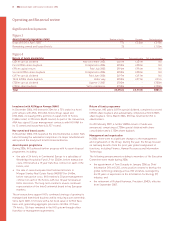
Revenue and operating profit from continuing operations increased
by 28.3% to $204m and 33.3% to $52m respectively during 2006.
Including discontinued operations, revenue and operating profit
declined by 20.6% and 11.9% respectively, reflecting the sale of
10 owned and leased hotels in Australasia and Fiji during 2005.
Continuing owned and leased operating profit increased by 55.0%
to $31m driven by trading at the InterContinental Hong Kong which
achieved rate-led RevPAR growth of over 30.0%. The hotel also
benefited from a rooms refurbishment programme and the prior
year repositioning of its food and beverage operations.
The managed estate achieved revenue growth of 44.4%, increasing
from $45m to $65m, due to the retention of management contracts
on the 10 owned and leased hotels sold in 2005 combined with
strong underlying trading in Greater China where comparable
RevPAR increased by 12.1% over 2005.
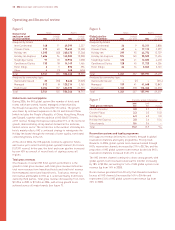
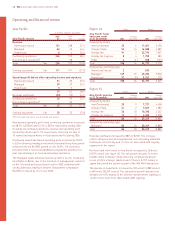
Figure 14 Hotels Rooms
Asia Pacific hotel
and room count Change Change
at 31 December 2006 over 2005 2006 over 2005
Analysed by brand:
InterContinental 33 611,651 2,190
Crowne Plaza 52 14 16,588 4,289
Holiday Inn 91 323,775 1,907
Holiday Inn Express 841,755 982
Other 4(1) 968 (139)
Total 188 26 54,737 9,229
Analysed by ownership type:
Owned and leased 2–693 –
Managed 149 29 45,282 9,050
Franchised 37 (3) 8,762 179
Total 188 26 54,737 9,229
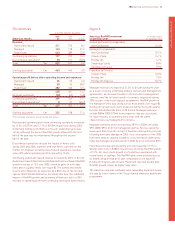
Figure 15
Hotels Rooms
Asia Pacific pipeline Change Change
at 31 December 2006 over 2005 2006 over 2005
Analysed by brand:
InterContinental 20 97,727 4,458
Crowne Plaza 21 27,607 1,582
Holiday Inn 33 10 10,390 3,262
Holiday Inn Express 12 94,525 3,578
Total 86 30 30,249 12,880
Analysed by ownership type:
Managed 86 30 30,249 12,880
Total 86 30 30,249 12,880
Regional overheads increased by $8m to $23m. The increase
reflects infrastructure and development costs including additional
headcount, office facility and IT costs, all associated with ongoing
expansion in the region.
Net hotel and room count in Asia Pacific increased by 26 hotels
(9,229 rooms) (see figure 14). The net growth includes 14 hotels
(3,628 rooms) in Greater China reflecting continued expansion
in one of IHG’s strategic markets and 13 hotels (4,937 rooms) in
Japan that joined the system as part of the IHG ANA transaction.
The pipeline in Asia Pacific increased by 30 hotels (12,880 rooms)
to 86 hotels (30,249 rooms). The substantial growth indicates the
demand for IHG’s brands in the Chinese market where signings of
16,445 rooms were more than double 2005 signings.
Operating and financial review
14 IHG Annual report and financial statements 2006