Holiday Inn 2006 Annual Report Download - page 17
Download and view the complete annual report
Please find page 17 of the 2006 Holiday Inn annual report below. You can navigate through the pages in the report by either clicking on the pages listed below, or by using the keyword search tool below to find specific information within the annual report.-
 1
1 -
2
-
3
-
4
-
5
-
6
-
 7
7 -
 8
8 -
 9
9 -
 10
10 -
 11
11 -
 12
12 -
 13
13 -
 14
14 -
 15
15 -
 16
16 -
 17
17 -
 18
18 -
 19
19 -
 20
20 -
 21
21 -
 22
22 -
 23
23 -
 24
24 -
 25
25 -
 26
26 -
 27
27 -
28
-
29
-
30
-
31
-
32
-
33
-
34
-
35
-
36
-
37
-
38
-
39
-
40
-
41
-
42
-
43
-
44
-
45
-
46
-
47
-
48
-
49
-
50
-
51
-
52
-
53
-
54
-
55
-
56
-
57
-
58
-
59
-
60
-
61
-
62
-
63
-
64
-
65
-
66
-
67
-
68
-
69
-
70
-
71
-
72
-
73
-
74
-
75
-
76
-
77
-
78
-
79
-
80
-
81
-
82
-
83
-
84
-
85
-
86
-
87
-
88
-
89
-
90
-
91
-
92
-
93
-
94
-
95
-
96
-
97
-
98
-
99
-
100
 |
 |

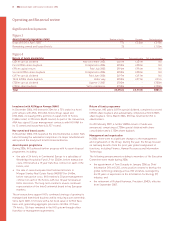
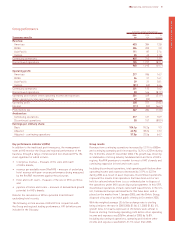
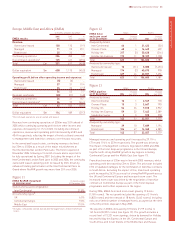
Central
12 months ended 31 December
2006 2005 %
Central results £m £m change
Revenue 55 42 31.0
Gross central costs (136) (107) 27.1
Net central costs £m (81) (65) 24.6
Dollar equivalent $m (149) (118) 26.3
Net central costs increased by £16m to £81m and included
significant investment in new global research, designed to enable
higher quality brand development and enhance IHG’s franchising
capability; the increase also included higher IT infrastructure costs.
Corporate information
Other operating income and expenses
Other operating income and expenses of £27m includes the gain
on the sale of the Group’s investment in FelCor Lodging Trust, Inc.
Other operating income and expenses are treated as special items
by reason of their size or incidence and are excluded from the
calculation of adjusted earnings per share in order to provide a
more meaningful comparison of performance.
Net financing costs
Net financing costs decreased from £33m in 2005 to £11m in 2006,
primarily as a result of significantly lower average debt levels in the
year (£92m in 2006 compared with £700m in 2005). Financing costs
included £10m (2005 £5m) of interest costs associated with Priority
Club Rewards where interest is charged on the accumulated
balance of cash received in advance of the redemption points
awarded. The increase over 2005 arises from growth in the scheme
membership and higher interest rates. Financing costs in 2006 also
included £4m in respect of the InterContinental Boston finance
lease. Prior year costs included £9m in respect of the discontinued
Soft Drinks business.
Taxation
The effective rate of tax on profit before tax, excluding the impact of
special items, was 24%. By also excluding the impact of prior year
items, which are included wholly within continuing operations, the
equivalent tax rate would be 36%. This rate is higher than the UK
statutory rate of 30% due mainly to overseas profits (predominantly
in the US) being subject to statutory rates higher than the UK
statutory rate, unrelieved losses and other disallowable expenses.
The equivalent effective rates for 2005 were 29% and 38%
respectively.
Taxation within special items totalled a credit of £94m (2005 £8m
credit). This represented, primarily, the release of provisions which
were special by reason of their size or incidence relating to tax
matters which were settled during the year, or in respect of which
the statutory limitation period had expired. In 2006, taxation special
items, in addition to such provision releases, included £12m for the
recognition of a deferred tax asset in respect of tax losses.
Net tax paid in 2006 totalled £49m (2005 £91m) including £6m
in respect of disposals.
Gain on disposal of assets
The gain on disposal of assets, net of related tax, totalled £117m
in 2006 and primarily comprised the gain on the sale of seven
InterContinental hotels to MSREF.
Earnings
Basic earnings per share in 2006 were 104.1p, compared with
95.2p in 2005. Adjusted earnings per share were 42.9p, against
38.2p in 2005. Adjusted continuing earnings per share were 37.5p,
66.7% up on last year.
Dividends
The Board has proposed a final dividend per share of 13.3p; with the
interim dividend of 5.1p, the normal dividend for 2006 will total 18.4p.
Share price and market capitalisation
The IHG share price closed at 1262.0p on 31 December 2006, up
from 839.5p on 31 December 2005. The market capitalisation of
the Group at the year end was £4.5bn.
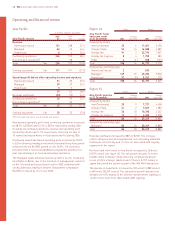
Cash flow
The net movement in cash and cash equivalents in the 12 months
to 31 December 2006 was an outflow of £152m. This included net
cash inflows from operating activities of £230m, net cash inflows
from investing activities of £620m and net cash outflows from
financing activities of £1,002m.
Proceeds from the disposal of hotels and other financial assets
totalled £744m.
Capital expenditure totalled £124m and included a major
refurbishment at the InterContinental London Park Lane and
the completion of a rooms refurbishment programme at the
InterContinental Hong Kong.
Cash outflows associated with shareholder returns during the year
included a special dividend of £497m and share buybacks of £260m.
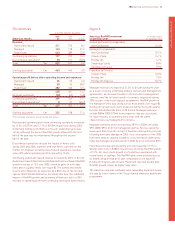
Capital structure and liquidity management
Net debt at 31 December 2006 was £134m (see figure 16). In
November 2006, the InterContinental Boston opened; this hotel
is operated under a finance lease and the lease commitment of
£97m is therefore included within Group borrowings.
Gearing (net debt expressed as a percentage of IHG shareholders’
equity) at 31 December 2006 was 20%.
IHG Operating and financial review 15
Operating and financial review