Holiday Inn 2006 Annual Report Download - page 60
Download and view the complete annual report
Please find page 60 of the 2006 Holiday Inn annual report below. You can navigate through the pages in the report by either clicking on the pages listed below, or by using the keyword search tool below to find specific information within the annual report.-
 1
1 -
2
-
3
-
4
-
5
-
6
-
7
-
8
-
9
-
10
-
11
-
12
-
13
-
14
-
15
-
16
-
17
-
18
-
19
-
20
-
21
-
22
-
23
-
24
-
25
-
26
-
27
-
28
-
29
-
30
-
31
-
32
-
33
-
34
-
35
-
36
-
37
-
38
-
39
-
40
-
41
-
42
-
43
-
44
-
45
-
46
-
47
-
48
-
49
-
 50
50 -
 51
51 -
 52
52 -
 53
53 -
 54
54 -
 55
55 -
 56
56 -
 57
57 -
 58
58 -
 59
59 -
 60
60 -
 61
61 -
 62
62 -
 63
63 -
 64
64 -
 65
65 -
 66
66 -
 67
67 -
 68
68 -
 69
69 -
 70
70 -
71
-
72
-
73
-
74
-
75
-
76
-
77
-
78
-
79
-
80
-
81
-
82
-
83
-
84
-
85
-
86
-
87
-
88
-
89
-
90
-
91
-
92
-
93
-
94
-
95
-
96
-
97
-
98
-
99
-
100
 |
 |

Notes to the Group financial statements
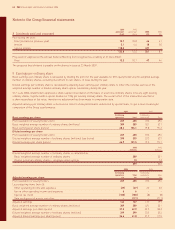
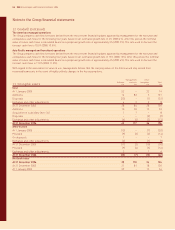
2 Segmental information (continued)
Year ended 31 December 2005*
Americas EMEA Asia Pacific Central Total Hotels Soft Drinks Total Group
Assets and liabilities £m £m £m £m £m £m £m
Segment assets 689 987 346 88 2,110 – 2,110
Non-current assets classified as held for sale 21 258 – – 279 – 279
710 1,245 346 88 2,389 – 2,389
Unallocated assets:
Current tax receivable 22 – 22
Cash and cash equivalents 324 – 324
Total assets 2,735 –2,735
Segment liabilities 340 261 50 – 651 – 651
Liabilities classified as held for sale 1 33 – – 34 – 34
341 294 50 – 685 – 685
Unallocated liabilities:
Current tax payable 324 – 324
Deferred tax payable 210 – 210
Loans and other borrowings 412 – 412
Total liabilities 1,631 –1,631
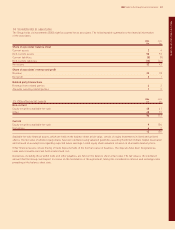
Americas EMEA Asia Pacific Central Total Hotels Soft Drinks Total Group
Other segmental information £m £m £m £m £m £m £m
Continuing operations:
Capital expenditurea22 19 28 13 82 – 82
Additions to:
Property, plant and equipment 12 15 30 6 63 – 63
Intangible assets 27 51 9 7 94 – 94
Depreciation and amortisationb19 15 8 15 57 – 57
Impairment of property, plant and equipment –7––7–7
Discontinued operations:
Capital expenditurea644 4 –5447101
Additions to:
Property, plant and equipment 4 33 4 – 41 36 77
Intangible assets –––––77
Depreciation and amortisationb124 3 –284573
* Other than for Soft Drinks which reflects the 50 weeks and three days ended 14 December.
a Comprises purchases of property, plant and equipment, intangible assets and other financial assets and acquisitions of subsidiaries as included in the Group cash
flow statement.
b Included in the £130m of depreciation and amortisation is £23m relating to administrative expenses and £107m relating to cost of sales.
58 IHG Annual report and financial statements 2006