Holiday Inn 2006 Annual Report Download - page 75
Download and view the complete annual report
Please find page 75 of the 2006 Holiday Inn annual report below. You can navigate through the pages in the report by either clicking on the pages listed below, or by using the keyword search tool below to find specific information within the annual report.-
 1
1 -
2
-
3
-
4
-
5
-
6
-
7
-
8
-
9
-
10
-
11
-
12
-
13
-
14
-
15
-
16
-
17
-
18
-
19
-
20
-
21
-
22
-
23
-
24
-
25
-
26
-
27
-
28
-
29
-
30
-
31
-
32
-
33
-
34
-
35
-
36
-
37
-
38
-
39
-
40
-
41
-
42
-
43
-
44
-
45
-
46
-
47
-
48
-
49
-
50
-
51
-
52
-
53
-
54
-
55
-
56
-
57
-
58
-
59
-
60
-
61
-
62
-
63
-
64
-
 65
65 -
 66
66 -
 67
67 -
 68
68 -
 69
69 -
 70
70 -
 71
71 -
 72
72 -
 73
73 -
 74
74 -
 75
75 -
 76
76 -
 77
77 -
 78
78 -
 79
79 -
 80
80 -
 81
81 -
 82
82 -
 83
83 -
 84
84 -
 85
85 -
86
-
87
-
88
-
89
-
90
-
91
-
92
-
93
-
94
-
95
-
96
-
97
-
98
-
99
-
100
 |
 |

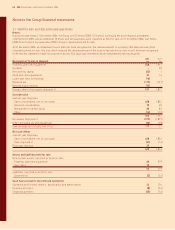
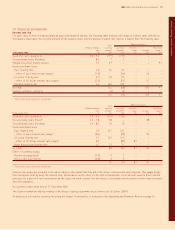
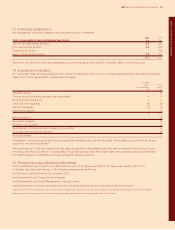
23 Employee benefits (continued)
The amounts recognised in the Group statement of recognised income and expense are:
Pension plans Post-employment
UK US benefits Total
2006 2005 2006 2005 2006 2005 2006 2005
Actuarial gains and losses £m £m £m £m £m £m £m £m
Actual return on scheme assets 21 79 64––27 83
Less: expected return on scheme assets (14) (32) (4) (5) ––(18) (37)
747 2(1) ––946
Other actuarial gains and losses (12) (67) –(3) 11(11) (69)
(5) (20) 2(4) 11(2) (23)
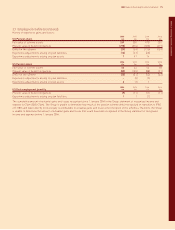
The assets and liabilities of the schemes are:
Pension plans Post-employment
UK US benefits Total
2006 2005 2006 2005 2006 2005 2006 2005
£m £m £m £m £m £m £m £m
Fair value of scheme assets 269 250 56 62 ––325 312
Present value of benefit obligations (298) (274) (89) (103) (9) (11) (396) (388)
Employee benefits liability (29) (24) (33) (41) (9) (11) (71) (76)
Comprising:
Funded plans (6) (2) (9) (14) ––(15) (16)
Unfunded plans (23) (22) (24) (27) (9) (11) (56) (60)
(29) (24) (33) (41) (9) (11) (71) (76)
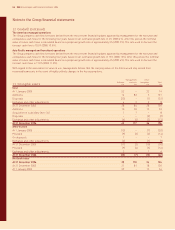
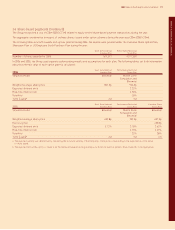
The principal assumptions used by the actuaries to determine the benefit obligation were:
Pension plans Post-employment
UK US benefits
2006 2005 2006 2005 2006 2005
%%%%%%
Wages and salaries increases 4.6 4.3 ––4.0 4.0
Pensions increases 3.1 2.8 ––––
Discount rate 5.0 4.7 5.8 5.5 5.8 5.5
Inflation rate 3.1 2.8 ––––
Healthcare cost trend rate assumed for next year 10.0 9.0
Ultimate rate that the cost trend rate trends to 5.0 4.5
In 2017 the healthcare cost trend rate reaches the assumed ultimate rate. A one per cent point increase/(decrease) in assumed healthcare
costs trend rate would increase/(decrease) the accumulated post-employment benefit obligations as of 31 December 2006 and 2005, by
approximately £1m, and would increase/(decrease) the total of the service and interest cost components of net post-employment
healthcare cost for the period then ended by approximately £nil.
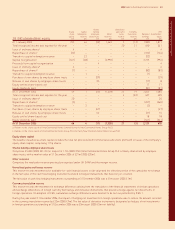
Pension plans
UK US
Post-retirement mortality (years) 2006 2005 2006 2005
Current pensioners at 65 – malea23 21 18 17
Current pensioners at 65 – femalea26 24 20 22
Future pensioners at 65 – maleb24 22 18 17
Future pensioners at 65 – femaleb27 25 20 22
a Relates to assumptions based on longevity (in years) following retirement at the balance sheet date.
b Relates to assumptions based on longevity (in years) relating to an employee retiring in 2026.
The post-retirement mortality assumptions allow for expected increases in longevity.
IHG Notes to the Group financial statements 73
Notes to the Group financial statements