Holiday Inn 2006 Annual Report Download - page 15
Download and view the complete annual report
Please find page 15 of the 2006 Holiday Inn annual report below. You can navigate through the pages in the report by either clicking on the pages listed below, or by using the keyword search tool below to find specific information within the annual report.-
 1
1 -
2
-
3
-
4
-
 5
5 -
 6
6 -
 7
7 -
 8
8 -
 9
9 -
 10
10 -
 11
11 -
 12
12 -
 13
13 -
 14
14 -
 15
15 -
 16
16 -
 17
17 -
 18
18 -
 19
19 -
 20
20 -
 21
21 -
 22
22 -
 23
23 -
 24
24 -
 25
25 -
26
-
27
-
28
-
29
-
30
-
31
-
32
-
33
-
34
-
35
-
36
-
37
-
38
-
39
-
40
-
41
-
42
-
43
-
44
-
45
-
46
-
47
-
48
-
49
-
50
-
51
-
52
-
53
-
54
-
55
-
56
-
57
-
58
-
59
-
60
-
61
-
62
-
63
-
64
-
65
-
66
-
67
-
68
-
69
-
70
-
71
-
72
-
73
-
74
-
75
-
76
-
77
-
78
-
79
-
80
-
81
-
82
-
83
-
84
-
85
-
86
-
87
-
88
-
89
-
90
-
91
-
92
-
93
-
94
-
95
-
96
-
97
-
98
-
99
-
100
 |
 |

IHG Operating and financial review 13
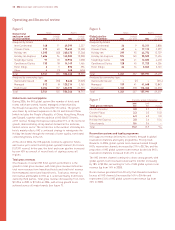
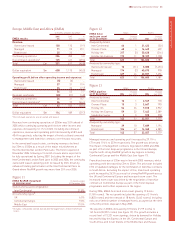
Figure 12
EMEA hotel Hotels Rooms
and room count Change Change
at 31 December 2006 over 2005 2006 over 2005
Analysed by brand:
InterContinental 66 121,423 (50)
Crowne Plaza 68 416,440 409
Holiday Inn 317 (3) 50,628 (316)
Holiday Inn Express 172 11 18,109 1,138
Total 623 13 106,600 1,181
Analysed by ownership type:
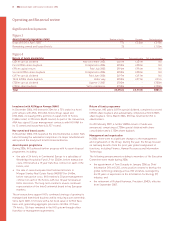
Owned and leased 10 (31) 3,088 (7,453)
Managed 174 (2) 40,675 978
Franchised 439 46 62,837 7,656
Total 623 13 106,600 1,181
Figure 13
Hotels Rooms
EMEA pipeline Change Change
at 31 December 2006 over 2005 2006 over 2005
Analysed by brand:
InterContinental 10 12,549 170
Crowne Plaza 15 33,667 790
Holiday Inn 54 26 7,818 2,952
Holiday Inn Express 59 22 7,445 3,289
Staybridge Suites 55578 578
Total 143 57 22,057 7,779
Analysed by ownership type:
Managed 39 10 7,689 1,194
Franchised 104 47 14,368 6,585
Total 143 57 22,057 7,779
Managed revenues and operating profit increased by 29.1% to
£71m and 19.4% to £37m respectively. The growth was driven by
the impact of management contracts negotiated in 2005 and 2006
as part of the hotel disposal programme in the UK and Europe,
together with strong RevPAR growth in key regions including
Continental Europe and the Middle East (see figure 11).
Franchised revenue of £35m was in line with 2005 revenues, whilst
operating profit decreased by £2m to £24m. The prior year included
£7m in liquidated damages for the termination of franchise contracts
in South Africa. Excluding the impact of this, franchised operating
profit increased by 26.3% as a result of strong RevPAR growth across
the UK and Continental Europe and increased room count. The
increased room count was driven by the negotiation of franchise
contracts in Continental Europe as part of the hotel disposal
programme and further expansion in the region.
During 2006, EMEA hotel and room count grew by 13 hotels
(1,181 rooms). The net growth included the opening of 31 hotels
(4,823 rooms) and the removal of 18 hotels (3,642 rooms), including
exits on a limited number of managed hotels, as agreed at the time
of the UK portfolio disposal in May 2005.
The pipeline in EMEA increased by 57 hotels (7,779 rooms) to
143 hotels (22,057 rooms) (see figure 13). The growth includes a
record level of 13,321 room signings, driven by demand for Holiday
Inn and Holiday Inn Express in the UK, Continental Europe and
South Africa, and for all brands in the Middle East and Russia.
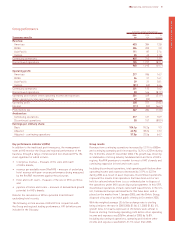
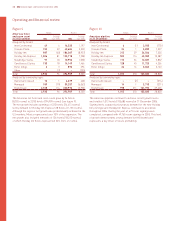
Operating and financial review
Europe, Middle East and Africa (EMEA)
12 months ended 31 December
2006 2005 %
EMEA results £m £m change
Revenue:
Owned and leased 100 110 (9.1)
Managed 71 55 29.1
Franchised 35 35 –
Continuing operations 206 200 3.0
Discontinued operations* 125 411 (69.6)
Total £m 331 611 (45.8)
Dollar equivalent $m 608 1,115 (45.5)
Operating profit before other operating income and expenses:
Owned and leased (5) (5) –
Managed 37 31 19.4
Franchised 24 26 (7.7)
56 52 7.7
Regional overheads (20) (21) (4.8)
Continuing operations 36 31 16.1
Discontinued operations* 26 73 (64.4)
Total £m 62 104 (40.4)
Dollar equivalent $m 114 189 (39.7)
*Discontinued operations are all owned and leased.
Revenue from continuing operations of £206m was 3.0% ahead of
2005 whilst continuing operating profit before other income and
expenses increased by 16.1% to £36m. Including discontinued
operations, revenue and operating profit decreased by 45.8% and
40.4% respectively, reflecting the impact of hotels sold and converted
to management and franchise contracts over the past two years.
In the owned and leased estate, continuing revenues declined
by £10m to £100m as a result of the major refurbishment at
the InterContinental London Park Lane. The hotel reopened in
November 2006 following a 13 month closure and is expected to
be fully operational by Spring 2007. Excluding the impact of the
InterContinental London Park Lane in 2005 and 2006, the continuing
owned and leased operating profit increased by £5m, driven by
enhanced trading performance at the InterContinental Paris Le
Grand where RevPAR growth was more than 25% over 2005.
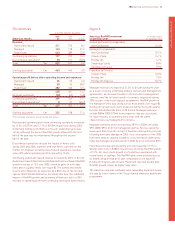
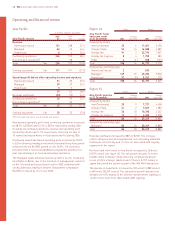
Figure 11
EMEA RevPAR movement 12 months ended
on previous year 31 December 2006
Owned and leased (comparable):
InterContinental 21.8%
All ownership types*:
UK 6.0%
Continental Europe 9.0%
Middle East 19.0%
*Includes comparable owned, leased and managed hotels and all franchised
hotels.