Holiday Inn 2006 Annual Report Download - page 12
Download and view the complete annual report
Please find page 12 of the 2006 Holiday Inn annual report below. You can navigate through the pages in the report by either clicking on the pages listed below, or by using the keyword search tool below to find specific information within the annual report.-
 1
1 -
 2
2 -
 3
3 -
 4
4 -
 5
5 -
 6
6 -
 7
7 -
 8
8 -
 9
9 -
 10
10 -
 11
11 -
 12
12 -
 13
13 -
 14
14 -
 15
15 -
 16
16 -
 17
17 -
 18
18 -
 19
19 -
 20
20 -
 21
21 -
 22
22 -
23
-
24
-
25
-
26
-
27
-
28
-
29
-
30
-
31
-
32
-
33
-
34
-
35
-
36
-
37
-
38
-
39
-
40
-
41
-
42
-
43
-
44
-
45
-
46
-
47
-
48
-
49
-
50
-
51
-
52
-
53
-
54
-
55
-
56
-
57
-
58
-
59
-
60
-
61
-
62
-
63
-
64
-
65
-
66
-
67
-
68
-
69
-
70
-
71
-
72
-
73
-
74
-
75
-
76
-
77
-
78
-
79
-
80
-
81
-
82
-
83
-
84
-
85
-
86
-
87
-
88
-
89
-
90
-
91
-
92
-
93
-
94
-
95
-
96
-
97
-
98
-
99
-
100
 |
 |

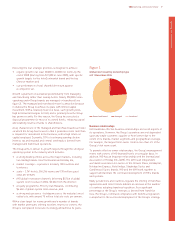
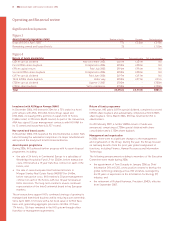
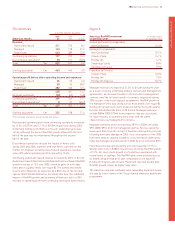
Operating and financial review
10 IHG Annual report and financial statements 2006
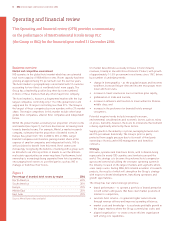
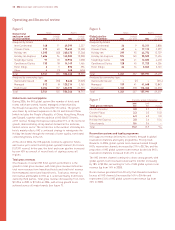
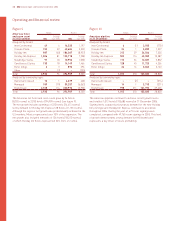
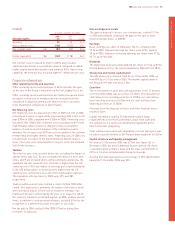
Figure 6
Hotels Rooms
Global pipeline Change Change
at 31 December 2006 over 2005 2006 over 2005
Analysed by brand:
InterContinental 36 913,211 3,858
Crowne Plaza 60 617,113 3,599
Holiday Inn 299 95 44,774 13,739
Holiday Inn Express 574 145 55,520 17,454
Staybridge Suites 120 41 12,605 4,410
Candlewood Suites 128 45 11,723 4,256
Hotel Indigo 24 16 3,045 2,163
Total 1,241 357 157,991 49,479
Analysed by ownership type:
Owned and leased –(2) –(574)
Managed 139 41 41,648 13,843
Franchised 1,102 318 116,343 36,210
Total 1,241 357 157,991 49,479
Figure 7 12 months ended 31 December
2006 2005 %
Total gross revenues $bn $bn change
InterContinental 3.0 2.7 11.1
Crowne Plaza 2.3 2.0 15.0
Holiday Inn 6.3 6.0 5.0
Holiday Inn Express 3.0 2.6 15.4
Other brands 0.6 0.6 –
Total 15.2 13.9 9.4
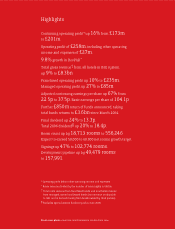
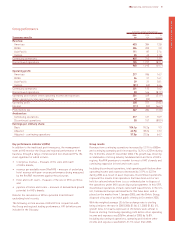
Reservation systems and loyalty programme
IHG supports revenue delivery into its hotels through its global
reservation channels and loyalty programme, Priority Club
Rewards. In 2006, global system room revenue booked through
IHG’s reservation channels increased by 21% to $5.7bn, and the
proportion of IHG global system room revenue booked via IHG’s
reservation channels increased from 41% to 44%.
The IHG internet channel continued to show strong growth, with
global system room revenue booked via the internet increasing
by 18% to $2.0bn, accounting for 16% of IHG global system room
revenue (up from 14% in 2005).
Room revenue generated from Priority Club Rewards members
(across all IHG channels) increased by 16% to $4.4bn and
represented 34% of IHG global system room revenue (up from
32% in 2005).
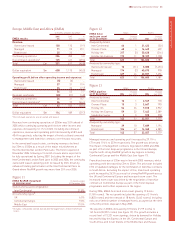
Figure 5
Global hotel Hotels Rooms
and room count Change Change
at 31 December 2006 over 2005 2006 over 2005
Analysed by brand:
InterContinental 148 11 49,599 3,337
Crowne Plaza 275 40 75,632 10,228
Holiday Inn 1,395 (40) 260,470 (7,346)
Holiday Inn Express 1,686 96 143,582 10,028
Staybridge Suites 97 10 10,953 1,038
Candlewood Suites 130 18 14,149 1,466
Hotel Indigo 63893 396
Other 4(3) 968 (434)
Total 3,741 135 556,246 18,713
Analysed by ownership type:
Owned and leased 25 (30) 8,460 (7,025)
Managed 512 8125,214 3,965
Franchised 3,204 157 422,572 21,773
Total 3,741 135 556,246 18,713
Global room count and pipeline
During 2006, the IHG global system (the number of hotels and
rooms which are owned, leased, managed or franchised by
the Group) increased by 135 hotels (18,713 rooms). The growth
was driven by continued expansion in the US and Greater China
(which includes the People’s Republic of China, Hong Kong, Macau
and Taiwan), together with the addition of IHG ANA (13 hotels,
4,937 rooms). Holiday Inn Express represented 71% of the net hotel
growth, demonstrating strong market demand in the midscale,
limited service sector. The net decline in the number of Holiday Inn
hotels mainly reflects IHG’s continued strategy to reinvigorate the
Holiday Inn brand through the removal of lower quality, non-brand
conforming hotels in the US.
At the end of 2006, the IHG pipeline (contracts signed for hotels
and rooms yet to enter the IHG global system) totalled 1,241 hotels
(157,991 rooms). In the year, the hotel and room pipeline increased
by over 40% as a result of record levels of signings across all
regions.
Total gross revenues
One measure of overall IHG hotel system performance is the
growth in total gross revenue, with total gross revenue defined as
total room revenue from franchised hotels and total hotel revenue
from managed, owned and leased hotels. Total gross revenue is
not revenue attributable to IHG, as it is derived mainly from hotels
owned by third parties. Total gross revenue increased by 9.4% from
$13.9bn in 2005 to $15.2bn in 2006, with strong growth levels
achieved across all major brands (see figure 7).