Harley Davidson 2013 Annual Report Download - page 99
Download and view the complete annual report
Please find page 99 of the 2013 Harley Davidson annual report below. You can navigate through the pages in the report by either clicking on the pages listed below, or by using the keyword search tool below to find specific information within the annual report.-
 1
1 -
2
-
3
-
4
-
5
-
6
-
7
-
8
-
9
-
10
-
11
-
12
-
13
-
14
-
15
-
16
-
17
-
18
-
19
-
20
-
21
-
22
-
23
-
24
-
25
-
26
-
27
-
28
-
29
-
30
-
31
-
32
-
33
-
34
-
35
-
36
-
37
-
38
-
39
-
40
-
41
-
42
-
43
-
44
-
45
-
46
-
47
-
48
-
49
-
50
-
51
-
52
-
53
-
54
-
55
-
56
-
57
-
58
-
59
-
60
-
61
-
62
-
63
-
64
-
65
-
66
-
67
-
68
-
69
-
70
-
71
-
72
-
73
-
74
-
75
-
76
-
77
-
78
-
79
-
80
-
81
-
82
-
83
-
84
-
85
-
86
-
87
-
88
-
 89
89 -
 90
90 -
 91
91 -
 92
92 -
 93
93 -
 94
94 -
 95
95 -
 96
96 -
 97
97 -
 98
98 -
 99
99 -
 100
100 -
 101
101 -
 102
102 -
 103
103 -
 104
104 -
 105
105 -
 106
106 -
 107
107 -
 108
108 -
 109
109 -
110
-
111
-
112
-
113
-
114
-
115
-
116
-
117
 |
 |

99
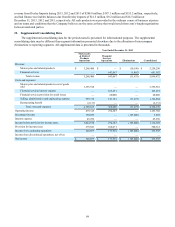
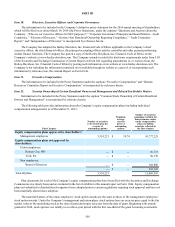
revenue from Deeley Imports during 2013, 2012 and 2011 of $204.8 million, $187.1 million and $155.2 million, respectively,
and had finance receivables balances due from Deeley Imports of $11.5 million, $9.2 million and $14.5 million at
December 31, 2013, 2012 and 2011, respectively. All such products were provided in the ordinary course of business at prices
and on terms and conditions that the Company believes are the same as those that would result from arm’s-length negotiations
between unrelated parties.
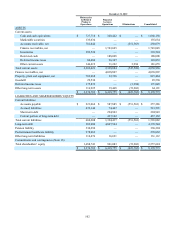
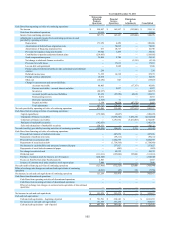
22. Supplemental Consolidating Data
The supplemental consolidating data for the periods noted is presented for informational purposes. The supplemental
consolidating data may be different than segment information presented elsewhere due to the allocation of intercompany
eliminations to reporting segments. All supplemental data is presented in thousands.
Year Ended December 31, 2013
Motorcycles
& Related
Products
Operations
Financial
Services
Operations Eliminations Consolidated
Revenue:
Motorcycles and related products $ 5,268,480 $ — $ (10,190) $ 5,258,290
Financial services — 643,067 (1,485) 641,582
Total revenue 5,268,480 643,067 (11,675) 5,899,872
Costs and expenses:
Motorcycles and related products cost of goods
sold 3,395,918 — — 3,395,918
Financial services interest expense — 165,491 — 165,491
Financial services provision for credit losses — 60,008 — 60,008
Selling, administrative and engineering expense 995,378 143,181 (11,675) 1,126,884
Restructuring benefit (2,131) — — (2,131)
Total costs and expenses 4,389,165 368,680 (11,675) 4,746,170
Operating income 879,315 274,387 — 1,153,702
Investment income 190,859 — (185,000) 5,859
Interest expense 45,256 — — 45,256
Income before provision for income taxes 1,024,918 274,387 (185,000) 1,114,305
Provision for income taxes 279,841 100,471 — 380,312
Income from continuing operations 745,077 173,916 (185,000) 733,993
Income from discontinued operations, net of tax — — — —
Net income $ 745,077 $ 173,916 $ (185,000) $ 733,993