Harley Davidson 2013 Annual Report Download - page 38
Download and view the complete annual report
Please find page 38 of the 2013 Harley Davidson annual report below. You can navigate through the pages in the report by either clicking on the pages listed below, or by using the keyword search tool below to find specific information within the annual report.-
 1
1 -
2
-
3
-
4
-
5
-
6
-
7
-
8
-
9
-
10
-
11
-
12
-
13
-
14
-
15
-
16
-
17
-
18
-
19
-
20
-
21
-
22
-
23
-
24
-
25
-
26
-
27
-
 28
28 -
 29
29 -
 30
30 -
 31
31 -
 32
32 -
 33
33 -
 34
34 -
 35
35 -
 36
36 -
 37
37 -
 38
38 -
 39
39 -
 40
40 -
 41
41 -
 42
42 -
 43
43 -
 44
44 -
 45
45 -
 46
46 -
 47
47 -
 48
48 -
49
-
50
-
51
-
52
-
53
-
54
-
55
-
56
-
57
-
58
-
59
-
60
-
61
-
62
-
63
-
64
-
65
-
66
-
67
-
68
-
69
-
70
-
71
-
72
-
73
-
74
-
75
-
76
-
77
-
78
-
79
-
80
-
81
-
82
-
83
-
84
-
85
-
86
-
87
-
88
-
89
-
90
-
91
-
92
-
93
-
94
-
95
-
96
-
97
-
98
-
99
-
100
-
101
-
102
-
103
-
104
-
105
-
106
-
107
-
108
-
109
-
110
-
111
-
112
-
113
-
114
-
115
-
116
-
117
 |
 |

38
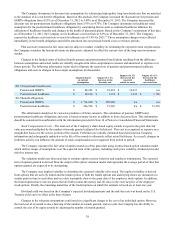
The Company determines its discount rate assumptions by referencing high-quality long-term bond rates that are matched
to the duration of its own benefit obligations. Based on this analysis, the Company increased the discount rate for pension and
SERPA obligations from 4.23% as of December 31, 2012 to 5.08% as of December 31, 2013. The Company increased the
discount rate for postretirement healthcare obligations from 3.93% to 4.70%. The Company determines its healthcare trend
assumption for the postretirement healthcare obligation by considering factors such as estimated healthcare inflation, the
utilization of healthcare benefits and changes in the health of plan participants. Based on the Company’s assessment of this data
as of December 31, 2013, the Company set its healthcare cost trend rate at 8.0% as of December 31, 2013. The Company
expects the healthcare cost trend rate to reach its ultimate rate of 5.0% by 2021.(1) These assumption changes were reflected
immediately in the benefit obligation and will be amortized into net periodic benefit costs over future periods.
Plan assets are measured at fair value and are subject to market volatility. In estimating the expected return on plan assets,
the Company considers the historical returns on plan assets, adjusted to reflect the current view of the long-term investment
market.
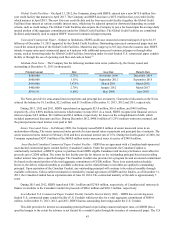
Changes in the funded status of defined benefit pension and postretirement benefit plans resulting from the difference
between assumptions and actual results are initially recognized in other comprehensive income and amortized to expense over
future periods. The following information is provided to illustrate the sensitivity of pension and postretirement healthcare
obligations and costs to changes in these major assumptions (in thousands):
Amounts based
on current
assumptions
Impact of a 1%
decrease in the
discount rate
Impact of a 1%
decrease in the
expected
return on assets
Impact of a 1%
increase in the
healthcare
cost trend rate
2013 Net periodic benefit costs
Pension and SERPA $ 48,262 $ 22,418 $ 16,431 n/a
Postretirement healthcare $ 18,616 $ 1,374 $ 1,193 $ 1,766
2013 Benefit obligations
Pension and SERPA $ 1,714,650 $ 289,968 n/a n/a
Postretirement healthcare $ 366,524 $ 37,266 n/a $ 13,318
This information should not be viewed as predictive of future amounts. The calculation of pension, SERPA and
postretirement healthcare obligations and costs is based on many factors in addition to those discussed here. This information
should be considered in combination with the information provided in Note 14 of Notes to Consolidated Financial Statements.
Stock Compensation Costs – The total cost of the Company’s share-based equity awards is equal to the grant date fair
value per award multiplied by the number of awards granted (adjusted for forfeitures). This cost is recognized as expense on a
straight-line basis over the service periods of the awards. Forfeitures are initially estimated based on historical Company
information and subsequently updated over the life of the awards to ultimately reflect actual forfeitures. As a result, changes in
forfeiture activity can influence the amount of stock compensation cost recognized from period to period.
The Company estimates the fair value of option awards as of the grant date using a lattice-based option valuation model
which utilizes ranges of assumptions over the expected term of the options, including stock price volatility, dividend yield and
risk-free interest rate.
The valuation model uses historical data to estimate option exercise behavior and employee terminations. The expected
term of options granted is derived from the output of the option valuation model and represents the average period of time that
options granted are expected to be outstanding.
The Company uses implied volatility to determine the expected volatility of its stock. The implied volatility is derived
from options that are actively traded and the market prices of both the traded options and underlying shares are measured at a
similar point in time to each other and on a date reasonably close to the grant date of the employee stock options. In addition,
the traded options have exercise prices that are both (a) near-the-money and (b) close to the exercise price of the employee
stock options. Finally, the remaining maturities of the traded options on which the estimate is based are at least one year.
Dividend yield was based on the Company’s expected dividend payments and the risk-free rate was based on the U.S.
Treasury yield curve in effect at the time of grant.
Changes in the valuation assumptions could result in a significant change to the cost of an individual option. However,
the total cost of an award is also a function of the number of awards granted, and as result, the Company has the ability to
control the cost of its equity awards by adjusting the number of awards granted.