Harley Davidson 2013 Annual Report Download - page 103
Download and view the complete annual report
Please find page 103 of the 2013 Harley Davidson annual report below. You can navigate through the pages in the report by either clicking on the pages listed below, or by using the keyword search tool below to find specific information within the annual report.-
 1
1 -
2
-
3
-
4
-
5
-
6
-
7
-
8
-
9
-
10
-
11
-
12
-
13
-
14
-
15
-
16
-
17
-
18
-
19
-
20
-
21
-
22
-
23
-
24
-
25
-
26
-
27
-
28
-
29
-
30
-
31
-
32
-
33
-
34
-
35
-
36
-
37
-
38
-
39
-
40
-
41
-
42
-
43
-
44
-
45
-
46
-
47
-
48
-
49
-
50
-
51
-
52
-
53
-
54
-
55
-
56
-
57
-
58
-
59
-
60
-
61
-
62
-
63
-
64
-
65
-
66
-
67
-
68
-
69
-
70
-
71
-
72
-
73
-
74
-
75
-
76
-
77
-
78
-
79
-
80
-
81
-
82
-
83
-
84
-
85
-
86
-
87
-
88
-
89
-
90
-
91
-
92
-
 93
93 -
 94
94 -
 95
95 -
 96
96 -
 97
97 -
 98
98 -
 99
99 -
 100
100 -
 101
101 -
 102
102 -
 103
103 -
 104
104 -
 105
105 -
 106
106 -
 107
107 -
 108
108 -
 109
109 -
 110
110 -
 111
111 -
 112
112 -
 113
113 -
114
-
115
-
116
-
117
 |
 |

103
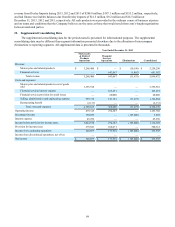
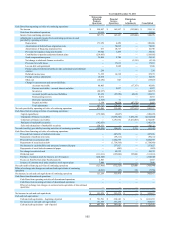
Year Ended December 31, 2013
Motorcycles
& Related
Products
Operations
Financial
Services
Operations
Eliminations
&
Adjustments Consolidated
Cash flows from operating activities:
Income from continuing operations $ 745,077 $ 173,916 $ (185,000) $ 733,993
Adjustments to reconcile income from continuing operations to cash
provided by operating activities:
Depreciation 160,181 6,891 — 167,072
Amortization of deferred loan origination costs — 86,181 — 86,181
Amortization of financing origination fees 473 8,903 — 9,376
Provision for employee long-term benefits 66,877 — — 66,877
Contributions to pension and postretirement plans (204,796) — — (204,796)
Stock compensation expense 38,367 2,877 — 41,244
Net change in wholesale finance receivables — — 28,865 28,865
Provision for credit losses — 60,008 — 60,008
Loss on debt extinguishment — 4,947 — 4,947
Deferred income taxes 54,568 (1,988) — 52,580
Foreign currency adjustments 16,269 — — 16,269
Other, net 10,942 (819) — 10,123
Change in current assets and current liabilities:
Accounts receivable (24,273) — (12,380) (36,653)
Finance receivables—accrued interest and other — (346) — (346)
Inventories (46,474) — — (46,474)
Accounts payable and accrued liabilities (60,907) (5,096) 12,380 (53,623)
Restructuring reserves (25,042) — — (25,042)
Derivative instruments (2,161) (28) — (2,189)
Prepaid and other 70,900 (2,219) — 68,681
Total adjustments 54,924 159,311 28,865 243,100
Net cash provided by operating activities of continuing operations 800,001 333,227 (156,135) 977,093
Cash flows from investing activities of continuing operations:
Capital expenditures (199,354) (8,967) — (208,321)
Origination of finance receivables — (7,140,533) 3,896,528 (3,244,005)
Collections of finance receivables — 6,757,387 (3,925,393) 2,831,994
Purchases of marketable securities (4,998) — — (4,998)
Sales and redemptions of marketable securities 40,108 — — 40,108
Other 16,355 — — 16,355
Net cash used by investing activities of continuing operations (147,889) (392,113) (28,865) (568,867)
Cash flows from financing activities of continuing operations:
Repayments of medium-term notes — (27,858) — (27,858)
Intercompany borrowing activity (50,000) 50,000 — —
Proceeds from securitization debt — 647,516 — 647,516
Repayments of securitization debt — (840,387) — (840,387)
Borrowings of asset-backed commercial paper — 88,456 — 88,456
Repayments of asset-backed commercial paper — (78,765) — (78,765)
Net increase in credit facilities and unsecured commercial paper — 371,085 — 371,085
Net change in restricted cash — 43,201 — 43,201
Dividends (187,688) (185,000) 185,000 (187,688)
Purchase of common stock for treasury (479,231) — — (479,231)
Excess tax benefits from share-based payments 19,895 — — 19,895
Issuance of common stock under employee stock option plans 50,567 — — 50,567
Net cash (used by) provided by financing activities of continuing operations (646,457) 68,248 185,000 (393,209)
Effect of exchange rate changes on cash and cash equivalents (14,459) (2,084) — (16,543)
Net (decrease) increase in cash and cash equivalents from continuing
operations $ (8,804) $ 7,278 $ — $ (1,526)
Cash and cash equivalents:
Cash and cash equivalents—beginning of period $ 727,716 $ 340,422 $ — $ 1,068,138
Net (decrease) increase in cash and cash equivalents (8,804) 7,278 — (1,526)
Cash and cash equivalents—end of period $ 718,912 $ 347,700 $ — $ 1,066,612