Harley Davidson 2013 Annual Report Download - page 88
Download and view the complete annual report
Please find page 88 of the 2013 Harley Davidson annual report below. You can navigate through the pages in the report by either clicking on the pages listed below, or by using the keyword search tool below to find specific information within the annual report.-
 1
1 -
2
-
3
-
4
-
5
-
6
-
7
-
8
-
9
-
10
-
11
-
12
-
13
-
14
-
15
-
16
-
17
-
18
-
19
-
20
-
21
-
22
-
23
-
24
-
25
-
26
-
27
-
28
-
29
-
30
-
31
-
32
-
33
-
34
-
35
-
36
-
37
-
38
-
39
-
40
-
41
-
42
-
43
-
44
-
45
-
46
-
47
-
48
-
49
-
50
-
51
-
52
-
53
-
54
-
55
-
56
-
57
-
58
-
59
-
60
-
61
-
62
-
63
-
64
-
65
-
66
-
67
-
68
-
69
-
70
-
71
-
72
-
73
-
74
-
75
-
76
-
77
-
 78
78 -
 79
79 -
 80
80 -
 81
81 -
 82
82 -
 83
83 -
 84
84 -
 85
85 -
 86
86 -
 87
87 -
 88
88 -
 89
89 -
 90
90 -
 91
91 -
 92
92 -
 93
93 -
 94
94 -
 95
95 -
 96
96 -
 97
97 -
 98
98 -
99
-
100
-
101
-
102
-
103
-
104
-
105
-
106
-
107
-
108
-
109
-
110
-
111
-
112
-
113
-
114
-
115
-
116
-
117
 |
 |

88
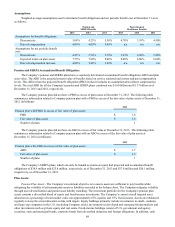
Assumptions:
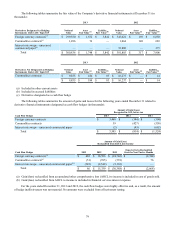
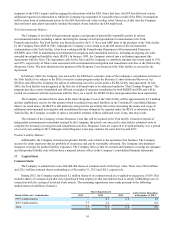
Weighted-average assumptions used to determine benefit obligations and net periodic benefit cost at December 31 were
as follows:
Pension and
SERPA Benefits Postretirement
Healthcare Benefits
2013 2012 2011 2013 2012 2011
Assumptions for benefit obligations:
Discount rate 5.08% 4.23% 5.30% 4.70% 3.93% 4.90%
Rate of compensation 4.00% 4.00% 3.49% n/a n/a n/a
Assumptions for net periodic benefit
cost:Discount rate 4.23% 5.30% 5.79% 3.93% 4.90% 5.28%
Expected return on plan assets 7.75% 7.80% 8.00% 8.00% 8.00% 8.00%
Rate of compensation increase 4.00% 3.49% 3.49% n/a n/a n/a
Pension and SERPA Accumulated Benefit Obligation:
The Company’s pension and SERPA plans have a separately determined accumulated benefit obligation (ABO) and plan
asset value. The ABO is the actuarial present value of benefits based on service rendered and current and past compensation
levels. This differs from the projected benefit obligation (PBO) in that it includes no assumption about future compensation
levels. The total ABO for all the Company’s pension and SERPA plans combined was $1.60 billion and $1.73 billion as of
December 31, 2013 and 2012, respectively.
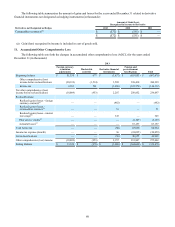
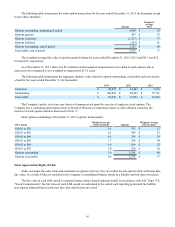
The Company pension plan did not have a PBO in excess of plan assets at December 31, 2013. The following table
summarizes information related to Company pension plan with a PBO in excess of the fair value of plan assets at December 31,
2012 (in billions):
2012
Pension plan with PBOs in excess of fair value of plan assets:
PBO $ 1.8
Fair value of plan assets $ 1.5
Number of plans 1
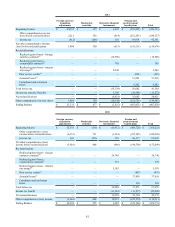
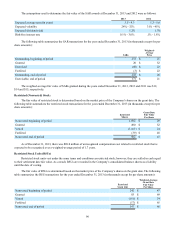
The Company pension plan did not have an ABO in excess of fair value at December 31, 2013. The following table
summarizes information related to Company pension plan with an ABO in excess of the fair value of plan assets at
December 31, 2012 (in billions):
2012
Pension plan with ABOs in excess of fair value of plan assets:
ABO $ 1.7
Fair value of plan assets $ 1.5
Number of plans 1
The Company’s SERPA plans, which can only be funded as claims are paid, had projected and accumulated benefit
obligations of $38.9 million and $25.8 million, respectively, as of December 31, 2013 and $37.8 million and $20.1 million,
respectively, as of December 31, 2012.
Plan Assets:
Pension Plan Assets - The Company’s investment objective is to ensure assets are sufficient to pay benefits while
mitigating the volatility of retirement plan assets or liabilities recorded in the balance sheet. The Company mitigates volatility
through asset diversification and partial asset/liability matching. The investment portfolio for the Company's pension plan
assets contains a diversified blend of equity and fixed-income investments. The Company’s current overall targeted asset
allocation as a percentage of total market value was approximately 65% equities and 35% fixed-income. Assets are rebalanced
regularly to keep the actual allocation in line with targets. Equity holdings primarily include investments in small-, medium-
and large-cap companies in the U.S. (including Company stock), investments in developed and emerging foreign markets and
other investments such as private equity and real estate. Fixed-income holdings consist of U.S. government and agency
securities, state and municipal bonds, corporate bonds from diversified industries and foreign obligations. In addition, cash