Harley Davidson 2013 Annual Report Download - page 98
Download and view the complete annual report
Please find page 98 of the 2013 Harley Davidson annual report below. You can navigate through the pages in the report by either clicking on the pages listed below, or by using the keyword search tool below to find specific information within the annual report.-
 1
1 -
2
-
3
-
4
-
5
-
6
-
7
-
8
-
9
-
10
-
11
-
12
-
13
-
14
-
15
-
16
-
17
-
18
-
19
-
20
-
21
-
22
-
23
-
24
-
25
-
26
-
27
-
28
-
29
-
30
-
31
-
32
-
33
-
34
-
35
-
36
-
37
-
38
-
39
-
40
-
41
-
42
-
43
-
44
-
45
-
46
-
47
-
48
-
49
-
50
-
51
-
52
-
53
-
54
-
55
-
56
-
57
-
58
-
59
-
60
-
61
-
62
-
63
-
64
-
65
-
66
-
67
-
68
-
69
-
70
-
71
-
72
-
73
-
74
-
75
-
76
-
77
-
78
-
79
-
80
-
81
-
82
-
83
-
84
-
85
-
86
-
87
-
 88
88 -
 89
89 -
 90
90 -
 91
91 -
 92
92 -
 93
93 -
 94
94 -
 95
95 -
 96
96 -
 97
97 -
 98
98 -
 99
99 -
 100
100 -
 101
101 -
 102
102 -
 103
103 -
 104
104 -
 105
105 -
 106
106 -
 107
107 -
 108
108 -
109
-
110
-
111
-
112
-
113
-
114
-
115
-
116
-
117
 |
 |
98
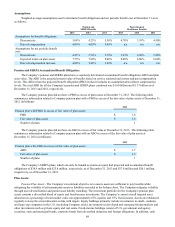
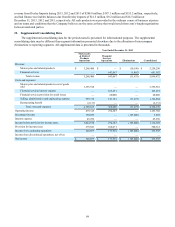
Financial Services revenue includes $10.4 million, $11.5 million and $10.5 million of interest that HDMC paid to HDFS
on wholesale finance receivables in 2013, 2012 and 2011, respectively. This interest was paid on behalf of HDMC’s
independent dealers as a way to enable dealers to manage seasonal increases in inventory. The offsetting cost of these interest
incentives was recorded as a reduction to Motorcycles revenue.
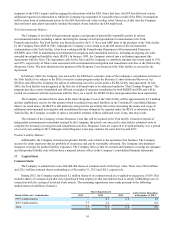
Information by industry segment is set forth below as of December 31, (in thousands):
Motorcycles Financial
Services Consolidated
2013
Total assets $ 2,793,497 $ 6,611,543 $ 9,405,040
Depreciation $ 160,181 $ 6,891 $ 167,072
Capital expenditures $ 199,354 $ 8,967 $ 208,321
2012
Total assets $ 2,751,018 $ 6,419,755 $ 9,170,773
Depreciation $ 162,659 $ 6,319 $ 168,978
Capital expenditures $ 180,416 $ 8,586 $ 189,002
2011
Total assets $ 2,959,333 $ 6,714,831 $ 9,674,164
Depreciation $ 173,959 $ 6,449 $ 180,408
Capital expenditures $ 179,988 $ 9,047 $ 189,035
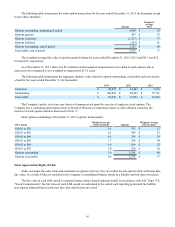
Geographic Information:
Included in the consolidated financial statements are the following amounts relating to geographic locations for the years
ended December 31 (in thousands):
2013 2012 2011
Revenue from Motorcycles(a):
United States $ 3,562,847 $ 3,363,640 $ 3,155,608
EMEA region 769,864 710,861 781,432
Japan 217,700 244,907 229,427
Canada 204,315 186,550 154,314
Australia 193,081 186,674 141,392
Other foreign countries 310,483 249,950 200,091
$ 5,258,290 $ 4,942,582 $ 4,662,264
Revenue from Financial Services(a):
United States $ 609,574 $ 607,909 $ 619,214
Europe 4,274 3,661 3,657
Canada 24,486 24,532 25,764
Other foreign countries 3,248 1,822 814
$ 641,582 $ 637,924 $ 649,449
Long-lived assets(b):
United States $ 874,833 $ 825,509 $ 822,089
International 36,860 56,143 59,571
$ 911,693 $ 881,652 $ 881,660
(a) Revenue is attributed to geographic regions based on location of customer.
(b) Long-lived assets include all long-term assets except those specifically excluded under ASC Topic 280, “Segment
Reporting,” such as deferred income taxes and finance receivables.
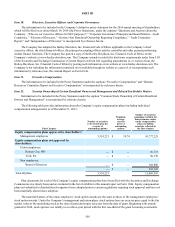
21. Related Party Transactions
The Company has the following material related party transactions. A director of the Company is Chairman and Chief
Executive Officer and an equity owner of Fred Deeley Imports Ltd. (Deeley Imports), the exclusive distributor of the
Company’s motorcycles in Canada. The Company recorded motorcycles and related products revenue and financial services