Harley Davidson 2013 Annual Report Download - page 30
Download and view the complete annual report
Please find page 30 of the 2013 Harley Davidson annual report below. You can navigate through the pages in the report by either clicking on the pages listed below, or by using the keyword search tool below to find specific information within the annual report.-
 1
1 -
2
-
3
-
4
-
5
-
6
-
7
-
8
-
9
-
10
-
11
-
12
-
13
-
14
-
15
-
16
-
17
-
18
-
19
-
 20
20 -
 21
21 -
 22
22 -
 23
23 -
 24
24 -
 25
25 -
 26
26 -
 27
27 -
 28
28 -
 29
29 -
 30
30 -
 31
31 -
 32
32 -
 33
33 -
 34
34 -
 35
35 -
 36
36 -
 37
37 -
 38
38 -
 39
39 -
 40
40 -
41
-
42
-
43
-
44
-
45
-
46
-
47
-
48
-
49
-
50
-
51
-
52
-
53
-
54
-
55
-
56
-
57
-
58
-
59
-
60
-
61
-
62
-
63
-
64
-
65
-
66
-
67
-
68
-
69
-
70
-
71
-
72
-
73
-
74
-
75
-
76
-
77
-
78
-
79
-
80
-
81
-
82
-
83
-
84
-
85
-
86
-
87
-
88
-
89
-
90
-
91
-
92
-
93
-
94
-
95
-
96
-
97
-
98
-
99
-
100
-
101
-
102
-
103
-
104
-
105
-
106
-
107
-
108
-
109
-
110
-
111
-
112
-
113
-
114
-
115
-
116
-
117
 |
 |

30
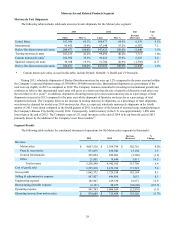
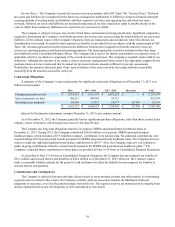
The following table includes the estimated impact of the significant factors affecting the comparability of net revenue,
cost of goods sold and gross profit from 2012 to 2013 (in millions):
Net
Revenue
Cost of
Goods
Sold Gross
Profit
2012 $ 4,943 $ 3,223 $ 1,720
Volume 230 159 71
Price 88 44 44
Foreign currency exchange rates and hedging (56)(17)(39)
Shipment mix 54 32 22
Raw material prices — (8) 8
Manufacturing costs — (36) 36
Total 316 174 142
2013 $ 5,259 $ 3,397 $ 1,862
The following factors affected the comparability of net revenue, cost of goods sold and gross profit from 2012 to 2013:
• Volume increases were driven by the increase in wholesale shipments of motorcycle units as well as higher sales
volumes for Parts & Accessories partially offset by lower General Merchandise sales volumes.
• On average, wholesale prices on the Company’s 2013 and 2014 model year motorcycles are higher than the preceding
model years resulting in the favorable impact on revenue and gross profit during the period. The impact of revenue
favorability resulting from model year price increases was partially offset by an increase in cost related to the
significant additional content added to the 2014 model year motorcycles.
• Foreign currency exchange rates during 2013 resulted in a negative impact on net revenue and gross profit primarily as
a result of devaluation in the Japanese yen, Australian dollar and Brazilian real.
• Shipment mix changes resulted primarily from favorable product mix changes between motorcycle platforms.
• Raw material prices were lower in 2013 relative to 2012 primarily due to lower metal costs.
• Manufacturing costs for 2013 were favorably impacted by savings related to restructuring initiatives, lower temporary
inefficiencies and a lower fixed cost per unit as a result of higher production volumes compared to 2012, partially
offset by approximately $7.0 million of higher start-up costs for the new model year driven by the significant level of
content added to the new models. Temporary inefficiencies associated with the Company’s restructuring activities
were $15 million in 2013 compared to $33 million in 2012. With the completion of the restructuring activities, the
Company has significantly reduced its fixed cost structure, and therefore improved the overall profitability of the
Company. At the start of restructuring, motorcycle fixed costs were in the range of 20% to 25% of total motorcycle
manufacturing costs. Beginning in 2014, the Company expects motorcycle fixed costs to be approximately 15% to
20% of total motorcycle manufacturing costs, resulting in gross margin on incremental motorcycle volume of
approximately 47%.(1)
The net decrease in operating expense was primarily due to lower restructuring charges and variable employee
compensation costs, partially offset by incremental investments to support the Company’s international growth and product
development initiatives and increases in the Company's global information systems costs. For further information regarding the
Company’s previously announced restructuring activities, refer to Note 4 of Notes to Condensed Consolidated Financial
Statements.