Harley Davidson 2013 Annual Report Download - page 79
Download and view the complete annual report
Please find page 79 of the 2013 Harley Davidson annual report below. You can navigate through the pages in the report by either clicking on the pages listed below, or by using the keyword search tool below to find specific information within the annual report.-
 1
1 -
2
-
3
-
4
-
5
-
6
-
7
-
8
-
9
-
10
-
11
-
12
-
13
-
14
-
15
-
16
-
17
-
18
-
19
-
20
-
21
-
22
-
23
-
24
-
25
-
26
-
27
-
28
-
29
-
30
-
31
-
32
-
33
-
34
-
35
-
36
-
37
-
38
-
39
-
40
-
41
-
42
-
43
-
44
-
45
-
46
-
47
-
48
-
49
-
50
-
51
-
52
-
53
-
54
-
55
-
56
-
57
-
58
-
59
-
60
-
61
-
62
-
63
-
64
-
65
-
66
-
67
-
68
-
 69
69 -
 70
70 -
 71
71 -
 72
72 -
 73
73 -
 74
74 -
 75
75 -
 76
76 -
 77
77 -
 78
78 -
 79
79 -
 80
80 -
 81
81 -
 82
82 -
 83
83 -
 84
84 -
 85
85 -
 86
86 -
 87
87 -
 88
88 -
 89
89 -
90
-
91
-
92
-
93
-
94
-
95
-
96
-
97
-
98
-
99
-
100
-
101
-
102
-
103
-
104
-
105
-
106
-
107
-
108
-
109
-
110
-
111
-
112
-
113
-
114
-
115
-
116
-
117
 |
 |

79
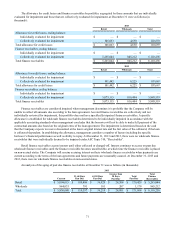
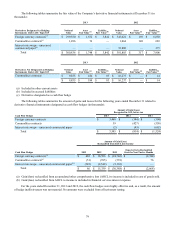
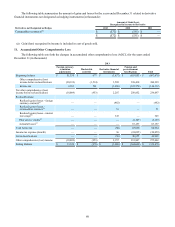
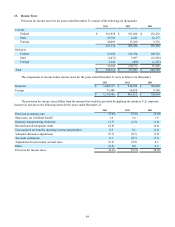
The following tables summarize the fair value of the Company’s derivative financial instruments at December 31 (in
thousands):
2013 2012
Derivatives Designated As Hedging
Instruments Under ASC Topic 815 Notional
Value Asset
Fair Value(a) Liability
Fair Value(b) Notional
Value Asset
Fair Value(a) Liability
Fair Value(b)
Foreign currency contracts(c) $ 299,550 $ 1,672 $ 3,842 $ 345,021 $ 169 $ 6,850
Commodities contracts(c) 1,286 76 — 1,064 148 683
Interest rate swaps – unsecured
commercial paper(c) — — — 35,800 — 373
Total $ 300,836 $ 1,748 $ 3,842 $ 381,885 $ 317 $ 7,906
2013 2012
Derivatives Not Designated As Hedging
Instruments Under ASC Topic 815 Notional
Value Asset
Fair Value(a) Liability
Fair Value(b) Notional
Value Asset
Fair Value(a) Liability
Fair Value(b)
Commodities contracts $ 9,855 $ 184 $ 83 $ 16,237 $ — $ 14
$ 9,855 $ 184 $ 83 $ 16,237 $ — $ 14
(a) Included in other current assets
(b) Included in accrued liabilities
(c) Derivative designated as a cash flow hedge
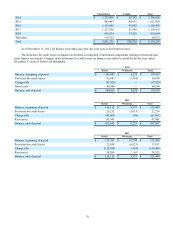
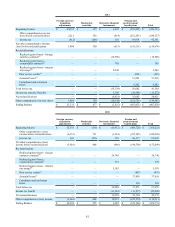
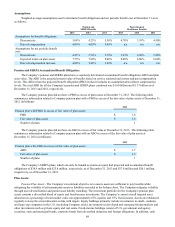
The following tables summarize the amount of gains and losses for the following years ended December 31 related to
derivative financial instruments designated as cash flow hedges (in thousands):
Amount of Gain/(Loss)
Recognized in OCI, before tax
Cash Flow Hedges 2013 2012 2011
Foreign currency contracts $ 3,468 $ (344) $ (304)
Commodities contracts 39 (427)(558)
Interest rate swaps – unsecured commercial paper (2)(43)(662)
Total $ 3,505 $ (814) $ (1,524)
Amount of Gain/(Loss)
Reclassified from AOCL into Income
Cash Flow Hedges 2013 2012 2011 Expected to be Reclassified
Over the Next Twelve Months
Foreign currency contracts(a) $ 482 $ 18,586 $ (24,746) $ (2,744)
Commodities contracts(a) (51)(705)(539) 76
Interest rate swaps – unsecured commercial paper(b) (345)(2,542)(5,103) —
Total $ 86 $ 15,339 $ (30,388) $ (2,668)
(a) Gain/(loss) reclassified from accumulated other comprehensive loss (AOCL) to income is included in cost of goods sold.
(b) Gain/(loss) reclassified from AOCL to income is included in financial services interest expense.
For the years ended December 31, 2013 and 2012, the cash flow hedges were highly effective and, as a result, the amount
of hedge ineffectiveness was not material. No amounts were excluded from effectiveness testing.