Harley Davidson 2013 Annual Report Download - page 97
Download and view the complete annual report
Please find page 97 of the 2013 Harley Davidson annual report below. You can navigate through the pages in the report by either clicking on the pages listed below, or by using the keyword search tool below to find specific information within the annual report.-
 1
1 -
2
-
3
-
4
-
5
-
6
-
7
-
8
-
9
-
10
-
11
-
12
-
13
-
14
-
15
-
16
-
17
-
18
-
19
-
20
-
21
-
22
-
23
-
24
-
25
-
26
-
27
-
28
-
29
-
30
-
31
-
32
-
33
-
34
-
35
-
36
-
37
-
38
-
39
-
40
-
41
-
42
-
43
-
44
-
45
-
46
-
47
-
48
-
49
-
50
-
51
-
52
-
53
-
54
-
55
-
56
-
57
-
58
-
59
-
60
-
61
-
62
-
63
-
64
-
65
-
66
-
67
-
68
-
69
-
70
-
71
-
72
-
73
-
74
-
75
-
76
-
77
-
78
-
79
-
80
-
81
-
82
-
83
-
84
-
85
-
86
-
 87
87 -
 88
88 -
 89
89 -
 90
90 -
 91
91 -
 92
92 -
 93
93 -
 94
94 -
 95
95 -
 96
96 -
 97
97 -
 98
98 -
 99
99 -
 100
100 -
 101
101 -
 102
102 -
 103
103 -
 104
104 -
 105
105 -
 106
106 -
 107
107 -
108
-
109
-
110
-
111
-
112
-
113
-
114
-
115
-
116
-
117
 |
 |

97
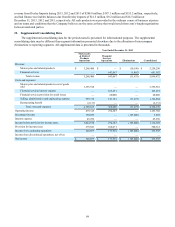
19. Earnings Per Share
The following table sets forth the computation of basic and diluted earnings per share from continuing operations for the
years ended December 31 (in thousands except per share amounts):
2013 2012 2011
Numerator:
Income from continuing operations used in computing basic and
diluted earnings per share $ 733,993 $ 623,925 $ 548,078
Denominator:
Denominator for basic earnings per share-weighted-average
common shares 222,475 227,119 232,889
Effect of dilutive securities – employee stock compensation plan 1,596 2,110 2,029
Denominator for diluted earnings per share- adjusted weighted-
average shares outstanding 224,071 229,229 234,918
Earnings per common share from continuing operations:
Basic $ 3.30 $ 2.75 $ 2.35
Diluted $ 3.28 $ 2.72 $ 2.33
Options to purchase 0.9 million, 2.1 million and 3.8 million weighted-average shares of common stock outstanding
during 2013, 2012 and 2011, respectively, were not included in the Company’s computation of dilutive securities because the
exercise price was greater than the market price and therefore the effect would have been anti-dilutive.
The Company has a share-based compensation plan under which employees may be granted share-based awards
including shares of restricted stock and restricted stock units (RSUs). Non-forfeitable dividends are paid on unvested shares of
restricted stock and non-forfeitable dividend equivalents are paid on unvested RSUs. As such, shares of restricted stock and
RSUs are considered participating securities under the two-class method of calculating earnings per share as described in ASC
Topic 260, “Earnings per Share.” The two-class method of calculating earnings per share did not have a material impact on the
Company’s earnings per share calculation as of December 31, 2013, 2012 and 2011.
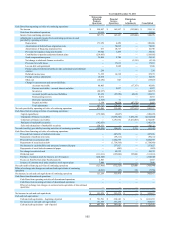
20. Business Segments and Geographic Information
Business Segments:
The Company operates in two business segments: Motorcycles and Financial Services. The Company’s reportable
segments are strategic business units that offer different products and services. They are managed separately based on the
fundamental differences in their operations.
The Motorcycles segment designs, manufactures and sells at wholesale 601+cc cruiser and touring motorcycles as well as
a line of motorcycle parts, accessories, general merchandise and related services.
The Financial Services segment provides wholesale and retail financing and provides insurance and insurance-related
programs primarily to Harley-Davidson dealers and their retail customers. HDFS conducts business principally in the United
States and Canada.
Information by segment is set forth below for the years ended December 31, (in thousands):
2013 2012 2011
Motorcycles net revenue $ 5,258,290 $ 4,942,582 $ 4,662,264
Gross profit 1,862,372 1,720,188 1,555,976
Selling, administrative and engineering expense 993,894 976,224 926,808
Restructuring (benefit) expense and other impairments (2,131) 28,475 67,992
Operating income from Motorcycles $ 870,609 $ 715,489 $ 561,176
Financial services revenue $ 641,582 $ 637,924 $ 649,449
Financial services expense 358,489 353,237 380,658
Operating income from Financial Services $ 283,093 $ 284,687 $ 268,791