Harley Davidson 2013 Annual Report Download - page 42
Download and view the complete annual report
Please find page 42 of the 2013 Harley Davidson annual report below. You can navigate through the pages in the report by either clicking on the pages listed below, or by using the keyword search tool below to find specific information within the annual report.-
 1
1 -
2
-
3
-
4
-
5
-
6
-
7
-
8
-
9
-
10
-
11
-
12
-
13
-
14
-
15
-
16
-
17
-
18
-
19
-
20
-
21
-
22
-
23
-
24
-
25
-
26
-
27
-
28
-
29
-
30
-
31
-
 32
32 -
 33
33 -
 34
34 -
 35
35 -
 36
36 -
 37
37 -
 38
38 -
 39
39 -
 40
40 -
 41
41 -
 42
42 -
 43
43 -
 44
44 -
 45
45 -
 46
46 -
 47
47 -
 48
48 -
 49
49 -
 50
50 -
 51
51 -
 52
52 -
53
-
54
-
55
-
56
-
57
-
58
-
59
-
60
-
61
-
62
-
63
-
64
-
65
-
66
-
67
-
68
-
69
-
70
-
71
-
72
-
73
-
74
-
75
-
76
-
77
-
78
-
79
-
80
-
81
-
82
-
83
-
84
-
85
-
86
-
87
-
88
-
89
-
90
-
91
-
92
-
93
-
94
-
95
-
96
-
97
-
98
-
99
-
100
-
101
-
102
-
103
-
104
-
105
-
106
-
107
-
108
-
109
-
110
-
111
-
112
-
113
-
114
-
115
-
116
-
117
 |
 |

42
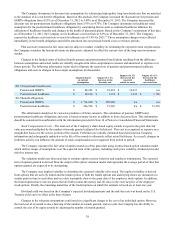
and related estimated tax payments during 2012. Additionally, the Company made voluntary contributions to its qualified
pension plans totaling $200 million in both 2012 and 2011, impacting operating cash flow in both years.
Investing Activities
The Company’s investing activities consist primarily of capital expenditures, net changes in retail finance receivables and
short-term investment activity. Capital expenditures were $208.3 million, $189.0 million and $189.0 million during 2013, 2012
and 2011, respectively.
Net cash flows from finance receivables for 2013, which consisted primarily of retail finance receivables, were $321.4
million lower than 2012 as a result of an increase in retail motorcycle loan originations during 2013. Net cash flows from
finance receivables for 2012, which consisted primarily of retail finance receivables, were $228.7 million lower than in 2011 as
a result of an increase in retail motorcycle loan originations during 2012.
Changes in the Company’s investment in marketable securities resulted in cash inflows of $35.1 million and $18.3
million in 2013 and 2012, respectively, and cash outflows of $12.5 million in 2011.
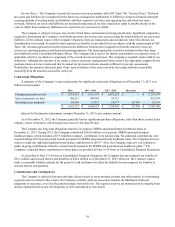
Financing Activities
The Company’s financing activities consist primarily of dividend payments, share repurchases and debt activity.
The Company paid dividends of $0.840 per share totaling $187.7 million during 2013, $0.620 per share totaling $141.7
million during 2012 and $0.475 per share totaling $111.0 million in 2011.
Cash outflows from share repurchases were $479.2 million, $311.6 million and $224.5 million for 2013, 2012 and 2011,
respectively. Share repurchases during 2013, 2012 and 2011 included 8.2 million, 6.7 million and 6.2 million shares of common
stock, respectively, related to discretionary share repurchases and shares of common stock that employees surrendered to satisfy
withholding taxes in connection with the vesting of restricted stock awards. In total at December 31, 2013, the Company had
board approved authorizations to repurchase 8.6 million shares of its common stock.
On February 5, 2014, the Company announced that the Company's Board of Directors had authorized the Company to
repurchase up to 20 million shares of its common stock. This Board authorization is in addition to existing share repurchase
authorizations.
The Company’s total outstanding debt consisted of the following as of December 31, 2013, 2012 and 2011 (in thousands):
2013 2012 2011
Global credit facilities $ — $ — $ 159,794
Unsecured commercial paper 666,317 294,943 874,286
Asset-backed Canadian commercial paper conduit facility 174,241 175,658 —
Medium-term notes 2,858,980 2,881,272 2,298,193
Senior unsecured notes 303,000 303,000 303,000
Term asset-backed securitization debt 1,256,632 1,447,776 2,087,346
Total debt $ 5,259,170 $ 5,102,649 $ 5,722,619
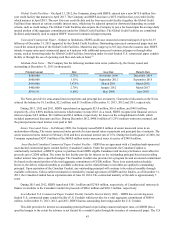
In order to access the debt capital markets, the Company relies on credit rating agencies to assign short-term and long-
term credit ratings. Generally, lower credit ratings result in higher borrowing costs and reduced access to debt capital markets.
A credit rating agency may change or withdraw the Company’s ratings based on its assessment of the Company’s current and
future ability to meet interest and principal repayment obligations. The Company’s short-term debt ratings affect its ability to
issue unsecured commercial paper. The Company’s short- and long-term debt ratings as of December 31, 2013 were as follows:
Short-Term Long-Term Outlook
Moody’s P2 Baa1 Positive
Standard & Poor’s A2 A- Stable
Fitch(a) F2 A- Positive
(a) On February 3, 2014, Fitch upgraded its short-term rating and long-term rating to F1 and A, respectively. Fitch also changed its outlook to stable.