Harley Davidson 2013 Annual Report Download - page 57
Download and view the complete annual report
Please find page 57 of the 2013 Harley Davidson annual report below. You can navigate through the pages in the report by either clicking on the pages listed below, or by using the keyword search tool below to find specific information within the annual report.-
 1
1 -
2
-
3
-
4
-
5
-
6
-
7
-
8
-
9
-
10
-
11
-
12
-
13
-
14
-
15
-
16
-
17
-
18
-
19
-
20
-
21
-
22
-
23
-
24
-
25
-
26
-
27
-
28
-
29
-
30
-
31
-
32
-
33
-
34
-
35
-
36
-
37
-
38
-
39
-
40
-
41
-
42
-
43
-
44
-
45
-
46
-
 47
47 -
 48
48 -
 49
49 -
 50
50 -
 51
51 -
 52
52 -
 53
53 -
 54
54 -
 55
55 -
 56
56 -
 57
57 -
 58
58 -
 59
59 -
 60
60 -
 61
61 -
 62
62 -
 63
63 -
 64
64 -
 65
65 -
 66
66 -
 67
67 -
68
-
69
-
70
-
71
-
72
-
73
-
74
-
75
-
76
-
77
-
78
-
79
-
80
-
81
-
82
-
83
-
84
-
85
-
86
-
87
-
88
-
89
-
90
-
91
-
92
-
93
-
94
-
95
-
96
-
97
-
98
-
99
-
100
-
101
-
102
-
103
-
104
-
105
-
106
-
107
-
108
-
109
-
110
-
111
-
112
-
113
-
114
-
115
-
116
-
117
 |
 |

57
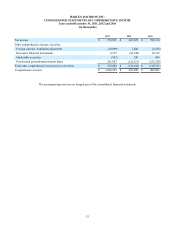
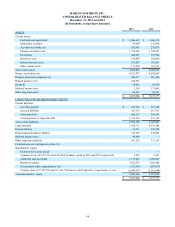
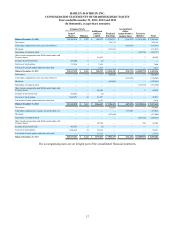
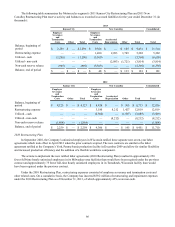
HARLEY-DAVIDSON, INC.
CONSOLIDATED STATEMENTS OF SHAREHOLDERS’ EQUITY
Years ended December 31, 2013, 2012 and 2011
(In thousands, except share amounts)
Common Stock Additional
paid-in
capital Retained
Earnings
Accumulated
Other
comprehensive
income (loss) Treasury
Balance Total
Issued
Shares Balance
Balance December 31, 2010 338,260,456 $ 3,382 $ 908,055 $ 6,336,077 $ (366,222) $(4,674,426) $ 2,206,866
Net Income — — — 599,114 — — 599,114
Total other comprehensive loss, net of tax (Note 11) — — — — (110,511) — (110,511)
Dividends — — — (111,011) — — (111,011)
Repurchase of common stock — — — — — (224,551)(224,551)
Share-based compensation and 401(k) match made with
Treasury shares — — 49,993 — — 3 49,996
Issuance of nonvested stock 473,240 5 (5) — — — —
Exercise of stock options 373,534 4 7,836 — — — 7,840
Tax benefit of stock options and nonvested stock — — 2,513 — — — 2,513
Balance December 31, 2011 339,107,230 $ 3,391 $ 968,392 $ 6,824,180 $ (476,733) $(4,898,974) $ 2,420,256
Net Income — — — 623,925 — — 623,925
Total other comprehensive loss, net of tax (Note 11) — — — — (130,945) — (130,945)
Dividends — — — (141,681) — — (141,681)
Repurchase of common stock — — — — — (311,632)(311,632)
Share-based compensation and 401(k) match made with
Treasury shares — — 42,056 — — 2 42,058
Issuance of nonvested stock 535,807 6 (6) — — — —
Exercise of stock options 1,622,801 16 45,957 — — — 45,973
Tax benefit of stock options and nonvested stock — — 9,670 — — — 9,670
Balance December 31, 2012 341,265,838 $ 3,413 $ 1,066,069 $ 7,306,424 $ (607,678) $(5,210,604) $ 2,557,624
Net Income — — — 733,993 — — 733,993
Total other comprehensive income, net of tax (Note 11) — — — — 275,002 — 275,002
Dividends — — — (187,688) — — (187,688)
Repurchase of common stock — — — — — (479,231)(479,231)
Share-based compensation and 401(k) match made with
Treasury shares — — 40,724 — — 784 41,508
Issuance of nonvested stock 492,755 5 (5) — — — —
Exercise of stock options 1,398,638 14 50,553 — — — 50,567
Tax benefit of stock options and nonvested stock — — 17,711 — — — 17,711
Balance December 31, 2013 343,157,231 $ 3,432 $ 1,175,052 $ 7,852,729 $ (332,676) $(5,689,051) $ 3,009,486
The accompanying notes are an integral part of the consolidated financial statements.