Harley Davidson 2013 Annual Report Download - page 80
Download and view the complete annual report
Please find page 80 of the 2013 Harley Davidson annual report below. You can navigate through the pages in the report by either clicking on the pages listed below, or by using the keyword search tool below to find specific information within the annual report.-
 1
1 -
2
-
3
-
4
-
5
-
6
-
7
-
8
-
9
-
10
-
11
-
12
-
13
-
14
-
15
-
16
-
17
-
18
-
19
-
20
-
21
-
22
-
23
-
24
-
25
-
26
-
27
-
28
-
29
-
30
-
31
-
32
-
33
-
34
-
35
-
36
-
37
-
38
-
39
-
40
-
41
-
42
-
43
-
44
-
45
-
46
-
47
-
48
-
49
-
50
-
51
-
52
-
53
-
54
-
55
-
56
-
57
-
58
-
59
-
60
-
61
-
62
-
63
-
64
-
65
-
66
-
67
-
68
-
69
-
 70
70 -
 71
71 -
 72
72 -
 73
73 -
 74
74 -
 75
75 -
 76
76 -
 77
77 -
 78
78 -
 79
79 -
 80
80 -
 81
81 -
 82
82 -
 83
83 -
 84
84 -
 85
85 -
 86
86 -
 87
87 -
 88
88 -
 89
89 -
 90
90 -
91
-
92
-
93
-
94
-
95
-
96
-
97
-
98
-
99
-
100
-
101
-
102
-
103
-
104
-
105
-
106
-
107
-
108
-
109
-
110
-
111
-
112
-
113
-
114
-
115
-
116
-
117
 |
 |

80
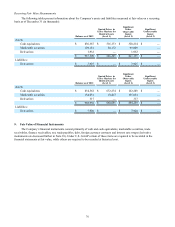
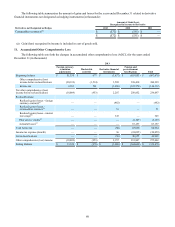
The following table summarizes the amount of gains and losses for the years ended December 31 related to derivative
financial instruments not designated as hedging instruments (in thousands):
Amount of Gain/(Loss)
Recognized in Income on Derivative
Derivatives not Designated as Hedges 2013 2012 2011
Commodities contracts(a) $(572) $ (535) $ —
$(572) $ (535) $ —
(a) Gain/(loss) recognized in income is included in cost of goods sold.
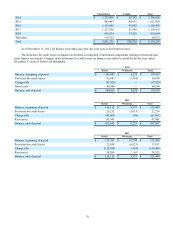
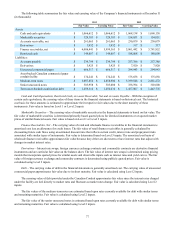
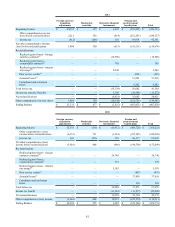
11. Accumulated Other Comprehensive Loss
The following table sets forth the changes in accumulated other comprehensive loss (AOCL) for the years ended
December 31 (in thousands):
2013
Foreign currency
translation
adjustments Marketable
securities Derivative financial
instruments
Pension and
postretirement
benefit plans Total
Beginning balance $ 51,335 $ 677 $ (3,837) $ (655,853) $ (607,678)
Other comprehensive (loss)
income before reclassifications (20,192) (1,514) 3,505 398,430 380,229
Income tax 2,183 561 (1,298) (147,578) (146,132)
Net other comprehensive (loss)
income before reclassifications (18,009) (953) 2,207 250,852 234,097
Reclassifications:
Realized (gains) losses - foreign
currency contracts(a) — — (482) — (482)
Realized (gains) losses -
commodities contracts(a) — — 51 — 51
Realized (gains) losses - interest
rate swaps(b) — — 345 — 345
Prior service credits(c) — — — (2,107) (2,107)
Actuarial losses(c) — — — 67,157 67,157
Total before tax — — (86) 65,050 64,964
Income tax expense (benefit) — — 36 (24,095) (24,059)
Net reclassifications — — (50) 40,955 40,905
Other comprehensive (loss) income (18,009) (953) 2,157 291,807 275,002
Ending Balance $ 33,326 $ (276) $ (1,680) $ (364,046) $ (332,676)