GameStop 2010 Annual Report Download - page 97
Download and view the complete annual report
Please find page 97 of the 2010 GameStop annual report below. You can navigate through the pages in the report by either clicking on the pages listed below, or by using the keyword search tool below to find specific information within the annual report.-
 1
1 -
2
-
3
-
4
-
5
-
6
-
7
-
8
-
9
-
10
-
11
-
12
-
13
-
14
-
15
-
16
-
17
-
18
-
19
-
20
-
21
-
22
-
23
-
24
-
25
-
26
-
27
-
28
-
29
-
30
-
31
-
32
-
33
-
34
-
35
-
36
-
37
-
38
-
39
-
40
-
41
-
42
-
43
-
44
-
45
-
46
-
47
-
48
-
49
-
50
-
51
-
52
-
53
-
54
-
55
-
56
-
57
-
58
-
59
-
60
-
61
-
62
-
63
-
64
-
65
-
66
-
67
-
68
-
69
-
70
-
71
-
72
-
73
-
74
-
75
-
76
-
77
-
78
-
79
-
80
-
81
-
82
-
83
-
84
-
85
-
86
-
 87
87 -
 88
88 -
 89
89 -
 90
90 -
 91
91 -
 92
92 -
 93
93 -
 94
94 -
 95
95 -
 96
96 -
 97
97 -
 98
98 -
 99
99 -
 100
100 -
 101
101 -
 102
102 -
 103
103 -
 104
104 -
 105
105 -
 106
106 -
 107
107 -
108
-
109
-
110
-
111
-
112
-
113
-
114
-
115
-
116
-
117
-
118
-
119
-
120
-
121
-
122
-
123
-
124
-
125
-
126
-
127
-
128
-
129
-
130
-
131
-
132
-
133
-
134
-
135
-
136
-
137
-
138
-
139
-
140
-
141
-
142
-
143
 |
 |

Table of Contents
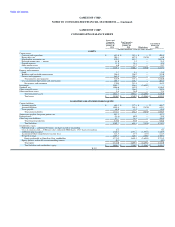
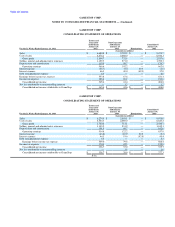
GAMESTOP CORP.
NOTES TO CONSOLIDATED FINANCIAL STATEMENTS — (Continued)
options vest and become exercisable in equal annual installments over a three-year period, commencing one year after the grant date, and expire ten
years from issuance. Shares issued upon exercise of options are newly issued shares.
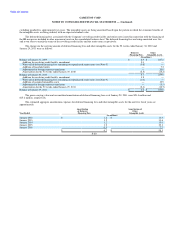
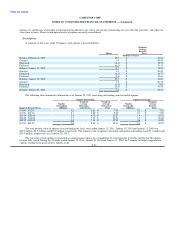
Stock Options
A summary of the status of the Company's stock options is presented below:
Weighted-
Average
Exercise
Shares Price
(Millions of shares)
Balance, February 2, 2008 10.9 $ 10.60
Granted 1.4 $ 49.95
Exercised (2.3) $ 12.70
Forfeited (0.3) $ 36.12
Balance, January 31, 2009 9.7 $ 14.96
Granted 1.4 $ 26.02
Exercised (0.3) $ 14.77
Forfeited (0.2) $ 35.61
Balance, January 30, 2010 10.6 $ 16.00
Granted 1.2 $ 20.32
Exercised (3.8) $ 2.85
Forfeited (0.4) $ 33.51
Balance, January 29, 2011 7.6 $ 22.43
The following table summarizes information as of January 29, 2011 concerning outstanding and exercisable options:
Options Outstanding Options Exercisable
Weighted- Weighted- Weighted-
Number Average Average Number Average
Outstanding Remaining Contractual Exercisable Exercise
Range of Exercise Prices (Millions) Life (Years) Price (Millions) Price
$ 5.90 - $ 8.24 0.2 2.62 $ 7.03 0.2 $ 7.03
$ 9.00 - $10.63 2.1 3.29 $ 9.69 2.1 $ 9.69
$17.94 - $20.68 2.6 6.78 $ 20.27 1.4 $ 20.22
$26.02 - $26.68 1.7 7.39 $ 26.23 1.0 $ 26.40
$49.95 - $49.95 1.0 7.03 $ 49.95 0.6 $ 49.95
$ 5.90 - $49.95 7.6 5.90 $ 22.43 5.3 $ 20.59
The total intrinsic value of options exercised during the fiscal years ended January 29, 2011, January 30, 2010 and January 31, 2009 was
$59.9 million, $3.7 million, and $87.9 million, respectively. The intrinsic value of options exercisable and options outstanding was $27.1 million and
$27.9 million, respectively, as of January 29, 2011.
The fair value of each option is recognized as compensation expense on a straight-line basis between the grant date and the date the options
become fully vested. During the 52 weeks ended January 29, 2011, January 30, 2010 and January 31, 2009, the Company included compensation
expense relating to the grant of these options in the F-27