GameStop 2010 Annual Report Download - page 45
Download and view the complete annual report
Please find page 45 of the 2010 GameStop annual report below. You can navigate through the pages in the report by either clicking on the pages listed below, or by using the keyword search tool below to find specific information within the annual report.-
 1
1 -
2
-
3
-
4
-
5
-
6
-
7
-
8
-
9
-
10
-
11
-
12
-
13
-
14
-
15
-
16
-
17
-
18
-
19
-
20
-
21
-
22
-
23
-
24
-
25
-
26
-
27
-
28
-
29
-
30
-
31
-
32
-
33
-
34
-
 35
35 -
 36
36 -
 37
37 -
 38
38 -
 39
39 -
 40
40 -
 41
41 -
 42
42 -
 43
43 -
 44
44 -
 45
45 -
 46
46 -
 47
47 -
 48
48 -
 49
49 -
 50
50 -
 51
51 -
 52
52 -
 53
53 -
 54
54 -
 55
55 -
56
-
57
-
58
-
59
-
60
-
61
-
62
-
63
-
64
-
65
-
66
-
67
-
68
-
69
-
70
-
71
-
72
-
73
-
74
-
75
-
76
-
77
-
78
-
79
-
80
-
81
-
82
-
83
-
84
-
85
-
86
-
87
-
88
-
89
-
90
-
91
-
92
-
93
-
94
-
95
-
96
-
97
-
98
-
99
-
100
-
101
-
102
-
103
-
104
-
105
-
106
-
107
-
108
-
109
-
110
-
111
-
112
-
113
-
114
-
115
-
116
-
117
-
118
-
119
-
120
-
121
-
122
-
123
-
124
-
125
-
126
-
127
-
128
-
129
-
130
-
131
-
132
-
133
-
134
-
135
-
136
-
137
-
138
-
139
-
140
-
141
-
142
-
143
 |
 |

Table of Contents
European video game market as a whole, and (iv) increasing the Company's impact on the European market, including increasing its purchasing
power.
Growth in the video game industry is generally driven by the introduction of new technology. The current generation of hardware consoles
(the Sony PlayStation 3, the Microsoft Xbox 360 and the Nintendo Wii) were introduced between 2005 and 2007. The Sony PlayStation Portable
(the "PSP") was introduced in 2005. The Nintendo DSi XL was introduced in early 2010. Typically, following the introduction of new video game
platforms, sales of new video game hardware increase as a percentage of total sales in the first full year following introduction. As video game
platforms mature, the sales mix attributable to complementary video game software and accessories, which generate higher gross margins, generally
increases in the subsequent years. The net effect is generally a decline in gross margins in the first full year following new platform releases and an
increase in gross margins in the years subsequent to the first full year following the launch period. Unit sales of maturing video game platforms are
typically also driven by manufacturer-funded retail price reductions, further driving sales of related software and accessories. We expect that the
installed base of the hardware platforms listed above and sales of related software and accessories will increase in the future.
Critical Accounting Policies
The Company believes that the following are its most significant accounting policies which are important in determining the reporting of
transactions and events:
Use of Estimates. The preparation of financial statements in conformity with accounting principles generally accepted in the United
States of America ("GAAP") requires management to make estimates and assumptions that affect the reported amounts of assets and liabilities,
the disclosure of contingent assets and liabilities at the date of the financial statements and the reported amounts of revenues and expenses
during the reporting period. In preparing these financial statements, management has made its best estimates and judgments of certain amounts
included in the financial statements, giving due consideration to materiality. Changes in the estimates and assumptions used by management
could have significant impact on the Company's financial results. Actual results could differ from those estimates.
Revenue Recognition. Revenue from the sales of the Company's products is recognized at the time of sale and is stated net of sales
discounts. The sales of used video game products are recorded at the retail price charged to the customer. Sales returns (which are not
significant) are recognized at the time returns are made. Subscription and advertising revenues are recorded upon release of magazines for sale
to consumers. Magazine subscription revenue is recognized on a straight-line basis over the subscription period. The revenue from the paid
membership of the Company's PowerUp Rewards loyalty program is recognized over the one-year membership term. Revenue from the sales
of product replacement plans is recognized on a straight-line basis over the coverage period. Gift cards sold to customers are recognized as a
liability on the balance sheet until redeemed.
The Company sells a variety of digital products which generally allow consumers to download software or play games on the internet.
Certain of these products do not require the Company to purchase inventory or take physical possession of, or take title to, inventory. When
purchasing these products from the Company, consumers pay a retail price and the Company earns a commission based on a percentage of the
retail sale as negotiated with the product publisher. The Company recognizes this commission as revenue on the sale of these digital products.
Stock-Based Compensation. The Company records share-based compensation expense in earnings based on the grant-date fair value of
options or restricted stock granted. As of January 29, 2011, the unrecognized compensation expense related to the unvested portion of our
stock options and restricted stock was $9.3 million and $14.8 million, respectively, which is expected to be recognized over a weighted
average period of 1.7 and 1.7 years, respectively. Note 1 of "Notes to Consolidated Financial Statements" provides additional information on
stock-based compensation.
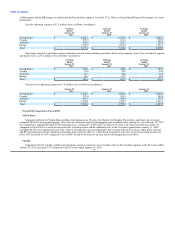
Merchandise Inventories. Our merchandise inventories are carried at the lower of cost or market generally using the average cost
method. Under the average cost method, as new product is received from
29