GameStop 2010 Annual Report Download - page 106
Download and view the complete annual report
Please find page 106 of the 2010 GameStop annual report below. You can navigate through the pages in the report by either clicking on the pages listed below, or by using the keyword search tool below to find specific information within the annual report.-
 1
1 -
2
-
3
-
4
-
5
-
6
-
7
-
8
-
9
-
10
-
11
-
12
-
13
-
14
-
15
-
16
-
17
-
18
-
19
-
20
-
21
-
22
-
23
-
24
-
25
-
26
-
27
-
28
-
29
-
30
-
31
-
32
-
33
-
34
-
35
-
36
-
37
-
38
-
39
-
40
-
41
-
42
-
43
-
44
-
45
-
46
-
47
-
48
-
49
-
50
-
51
-
52
-
53
-
54
-
55
-
56
-
57
-
58
-
59
-
60
-
61
-
62
-
63
-
64
-
65
-
66
-
67
-
68
-
69
-
70
-
71
-
72
-
73
-
74
-
75
-
76
-
77
-
78
-
79
-
80
-
81
-
82
-
83
-
84
-
85
-
86
-
87
-
88
-
89
-
90
-
91
-
92
-
93
-
94
-
95
-
 96
96 -
 97
97 -
 98
98 -
 99
99 -
 100
100 -
 101
101 -
 102
102 -
 103
103 -
 104
104 -
 105
105 -
 106
106 -
 107
107 -
 108
108 -
 109
109 -
 110
110 -
 111
111 -
 112
112 -
 113
113 -
 114
114 -
 115
115 -
 116
116 -
117
-
118
-
119
-
120
-
121
-
122
-
123
-
124
-
125
-
126
-
127
-
128
-
129
-
130
-
131
-
132
-
133
-
134
-
135
-
136
-
137
-
138
-
139
-
140
-
141
-
142
-
143
 |
 |

Table of Contents
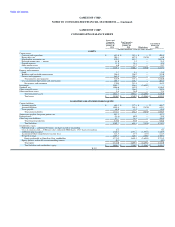
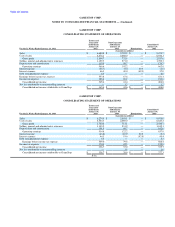
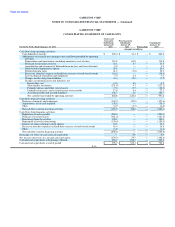
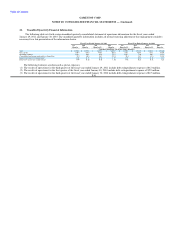
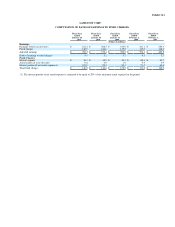
GAMESTOP CORP.
NOTES TO CONSOLIDATED FINANCIAL STATEMENTS — (Continued)
GAMESTOP CORP.
CONSOLIDATING STATEMENT OF OPERATIONS
Issuers and
Guarantor Non-Guarantor
Subsidiaries Subsidiaries Consolidated
January 29, January 29, January 29,
For the 52 Weeks Ended January 29, 2011 2011 2011 Eliminations 2011
(Amounts in millions)
Sales $ 6,680.8 $ 2,792.9 $ — $ 9,473.7
Cost of sales 4,876.1 2,060.0 — 6,936.1
Gross profit 1,804.7 732.9 — 2,537.6
Selling, general and administrative expenses 1,129.3 571.0 — 1,700.3
Depreciation and amortization 115.0 59.7 — 174.7
Operating earnings 560.4 102.2 — 662.6
Interest income (45.7) (5.4) 49.3 (1.8)
Interest expense 46.3 40.0 (49.3) 37.0
Debt extinguishment expense 6.0 — — 6.0
Earnings before income tax expense 553.8 67.6 — 621.4
Income tax expense 188.4 26.2 — 214.6
Consolidated net income 365.4 41.4 — 406.8
Net loss attributable to noncontrolling interests — 1.2 — 1.2
Consolidated net income attributable to GameStop $ 365.4 $ 42.6 $ — $ 408.0
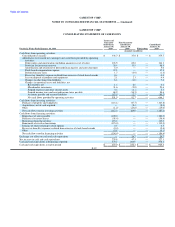
GAMESTOP CORP.
CONSOLIDATING STATEMENT OF OPERATIONS
Issuers and
Guarantor Non-Guarantor
Subsidiaries Subsidiaries Consolidated
January 30, January 30, January 30,
For the 52 Weeks Ended January 30, 2010 2010 2010 Eliminations 2010
(Amounts in millions)
Sales $ 6,274.9 $ 2,803.1 $ — $ 9,078.0
Cost of sales 4,554.3 2,089.0 — 6,643.3
Gross profit 1,720.6 714.1 — 2,434.7
Selling, general and administrative expenses 1,103.9 531.2 — 1,635.1
Depreciation and amortization 101.9 60.7 — 162.6
Operating earnings 514.8 122.2 — 637.0
Interest income (43.8) (10.9) 52.5 (2.2)
Interest expense 44.3 53.6 (52.5) 45.4
Debt extinguishment expense 5.3 — — 5.3
Earnings before income tax expense 509.0 79.5 — 588.5
Income tax expense 170.3 42.5 — 212.8
Consolidated net income 338.7 37.0 — 375.7
Net loss attributable to noncontrolling interests — 1.6 — 1.6
Consolidated net income attributable to GameStop $ 338.7 $ 38.6 $ — $ 377.3
F-36