GameStop 2010 Annual Report Download - page 74
Download and view the complete annual report
Please find page 74 of the 2010 GameStop annual report below. You can navigate through the pages in the report by either clicking on the pages listed below, or by using the keyword search tool below to find specific information within the annual report.-
 1
1 -
2
-
3
-
4
-
5
-
6
-
7
-
8
-
9
-
10
-
11
-
12
-
13
-
14
-
15
-
16
-
17
-
18
-
19
-
20
-
21
-
22
-
23
-
24
-
25
-
26
-
27
-
28
-
29
-
30
-
31
-
32
-
33
-
34
-
35
-
36
-
37
-
38
-
39
-
40
-
41
-
42
-
43
-
44
-
45
-
46
-
47
-
48
-
49
-
50
-
51
-
52
-
53
-
54
-
55
-
56
-
57
-
58
-
59
-
60
-
61
-
62
-
63
-
 64
64 -
 65
65 -
 66
66 -
 67
67 -
 68
68 -
 69
69 -
 70
70 -
 71
71 -
 72
72 -
 73
73 -
 74
74 -
 75
75 -
 76
76 -
 77
77 -
 78
78 -
 79
79 -
 80
80 -
 81
81 -
 82
82 -
 83
83 -
 84
84 -
85
-
86
-
87
-
88
-
89
-
90
-
91
-
92
-
93
-
94
-
95
-
96
-
97
-
98
-
99
-
100
-
101
-
102
-
103
-
104
-
105
-
106
-
107
-
108
-
109
-
110
-
111
-
112
-
113
-
114
-
115
-
116
-
117
-
118
-
119
-
120
-
121
-
122
-
123
-
124
-
125
-
126
-
127
-
128
-
129
-
130
-
131
-
132
-
133
-
134
-
135
-
136
-
137
-
138
-
139
-
140
-
141
-
142
-
143
 |
 |
Table of Contents
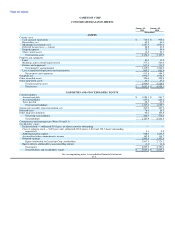
GAMESTOP CORP.
CONSOLIDATED BALANCE SHEETS
January 29, January 30,
2011 2010
(In millions)
ASSETS
Current assets:
Cash and cash equivalents $ 710.8 $ 905.4
Receivables, net 65.5 64.0
Merchandise inventories, net 1,257.5 1,053.6
Deferred income taxes — current 28.8 21.2
Prepaid expenses 75.7 59.4
Other current assets 16.5 23.7
Total current assets 2,154.8 2,127.3
Property and equipment:
Land 24.0 11.5
Buildings and leasehold improvements 577.2 523.0
Fixtures and equipment 817.8 711.5
Total property and equipment 1,419.0 1,246.0
Less accumulated depreciation and amortization 805.2 661.8
Net property and equipment 613.8 584.2
Goodwill, net 1,996.3 1,946.5
Other intangible assets 254.6 259.9
Other noncurrent assets 44.3 37.4
Total noncurrent assets 2,909.0 2,828.0
Total assets $ 5,063.8 $ 4,955.3
LIABILITIES AND STOCKHOLDERS' EQUITY
Current liabilities:
Accounts payable $ 1,028.1 $ 961.7
Accrued liabilities 657.0 632.1
Taxes payable 62.7 61.9
Total current liabilities 1,747.8 1,655.7
Senior notes payable, long-term portion, net 249.0 447.3
Deferred taxes 74.9 25.5
Other long-term liabilities 96.2 103.8
Total long-term liabilities 420.1 576.6
Total liabilities 2,167.9 2,232.3
Commitments and contingencies (Notes 10 and 11)
Stockholders' equity:
Preferred stock — authorized 5.0 shares; no shares issued or outstanding — —
Class A common stock — $.001 par value; authorized 300.0 shares; 146.0 and 158.7 shares outstanding,
respectively 0.1 0.2
Additional paid-in-capital 928.9 1,210.5
Accumulated other comprehensive income 162.5 114.7
Retained earnings 1,805.8 1,397.8
Equity attributable to GameStop Corp. stockholders 2,897.3 2,723.2
Equity (deficit) attributable to noncontrolling interest (1.4) (0.2)
Total equity 2,895.9 2,723.0
Total liabilities and stockholders' equity $ 5,063.8 $ 4,955.3
See accompanying notes to consolidated financial statements.
F-4