GameStop 2010 Annual Report Download - page 56
Download and view the complete annual report
Please find page 56 of the 2010 GameStop annual report below. You can navigate through the pages in the report by either clicking on the pages listed below, or by using the keyword search tool below to find specific information within the annual report.-
 1
1 -
2
-
3
-
4
-
5
-
6
-
7
-
8
-
9
-
10
-
11
-
12
-
13
-
14
-
15
-
16
-
17
-
18
-
19
-
20
-
21
-
22
-
23
-
24
-
25
-
26
-
27
-
28
-
29
-
30
-
31
-
32
-
33
-
34
-
35
-
36
-
37
-
38
-
39
-
40
-
41
-
42
-
43
-
44
-
45
-
 46
46 -
 47
47 -
 48
48 -
 49
49 -
 50
50 -
 51
51 -
 52
52 -
 53
53 -
 54
54 -
 55
55 -
 56
56 -
 57
57 -
 58
58 -
 59
59 -
 60
60 -
 61
61 -
 62
62 -
 63
63 -
 64
64 -
 65
65 -
 66
66 -
67
-
68
-
69
-
70
-
71
-
72
-
73
-
74
-
75
-
76
-
77
-
78
-
79
-
80
-
81
-
82
-
83
-
84
-
85
-
86
-
87
-
88
-
89
-
90
-
91
-
92
-
93
-
94
-
95
-
96
-
97
-
98
-
99
-
100
-
101
-
102
-
103
-
104
-
105
-
106
-
107
-
108
-
109
-
110
-
111
-
112
-
113
-
114
-
115
-
116
-
117
-
118
-
119
-
120
-
121
-
122
-
123
-
124
-
125
-
126
-
127
-
128
-
129
-
130
-
131
-
132
-
133
-
134
-
135
-
136
-
137
-
138
-
139
-
140
-
141
-
142
-
143
 |
 |

Table of Contents
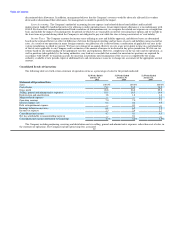
compared to fiscal 2008. The decrease in existing store sales was primarily driven by weak consumer traffic due to the continued macroeconomic
weakness and a slow-down in hardware unit sell-through.
The segment operating income in Europe for the 52 weeks ended January 30, 2010 increased by 2.4% to $67.2 million compared to
$65.6 million in the 52 weeks ended January 31, 2009. The increase in the operating income was primarily due to the favorable impact of changes in
exchange rates which had the effect of increasing operating earnings by $5.2 million when compared to fiscal 2008. The decrease in operating
earnings excluding the exchange rate effect from fiscal 2008 was due to the decrease in sales at existing stores and the increase in selling, general
and administrative expenses associated with the increase in the number of stores in operation.
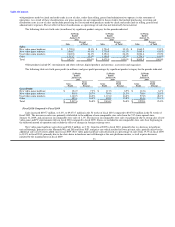
Liquidity and Capital Resources
Cash Flows
During fiscal 2010, cash provided by operations was $591.2 million, compared to cash provided by operations of $644.2 million in fiscal 2009.
The decrease in cash provided by operations of $53.0 million from fiscal 2009 to fiscal 2010 was primarily due to an increase in cash used for
inventory, partially offset by the increase in accounts payable and accrued liabilities, the increase in prepaid expenses and other current assets and
the increase in other long-term liabilities, as well as the changes in the adjustment related to the excess tax benefits realized from the exercise of
stock-based awards, which decreased cash provided by operations by $18.6 million. These decreases were partially offset by an increase in cash
provided by consolidated net income, including the non-cash adjustments to earnings. The increase in net inventory was primarily due to higher
purchases during fiscal 2010, particularly during the holiday season primarily related to hardware units which were at lower in-stock positions at the
end of fiscal 2009.
During fiscal 2009, cash provided by operations was $644.2 million, compared to cash provided by operations of $549.2 million in fiscal 2008.
The increase in cash provided by operations of $95.0 million from fiscal 2008 to fiscal 2009 was primarily due to an increase in cash provided by the
decrease in inventory, net of the decrease in accounts payable and accrued liabilities, the increase in income taxes payable and deferred taxes, as well
as the changes in the adjustment related to the excess tax benefits realized from the exercise of stock-based awards which decreased by
$34.6 million. The decrease in net inventory was primarily due to lower overall purchases during fiscal 2009 as a result of the continued
macroeconomic weakness and our efforts to effectively manage inventory levels. Inventory turnover also decreased in fiscal 2009 compared to fiscal
2008, primarily due to the growth in the international segments which have lower inventory turns compared to the United States segment due to their
lower overall store count and multiple warehouse facilities. The increase in cash related to income taxes payable and deferred income taxes in fiscal
2009 compared to fiscal 2008 was primarily due to the timing of the recognition of deferred income tax items and the timing of estimated income tax
payments at the end of fiscal 2009.
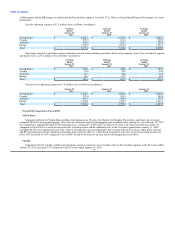
Cash used in investing activities was $240.1 million in fiscal 2010, $187.2 million in fiscal 2009 and $820.9 million in fiscal 2008. During
fiscal 2010, the Company used $202.0 million for capital expenditures primarily to open 359 stores and to invest in information systems and
$38.1 million for acquisitions in support of the Company's digital initiatives. During fiscal 2009, the Company used $178.8 million for capital
expenditures primarily to open 388 new stores and to invest in information systems. In addition, the Company used $8.4 million on acquisitions.
During fiscal 2008, the Company used $580.4 million, net of cash acquired, to purchase Micromania and $50.3 million, net of cash acquired, to
acquire Free Record Shop Norway AS, The Gamesman Limited and an increased ownership interest in GameStop Group Limited. In addition,
during fiscal 2008, $190.2 million of cash was used for capital expenditures primarily to open 674 new stores and to invest in information systems.
Cash used in financing activities was $555.6 million in fiscal 2010. Cash used in financing activities was $154.4 million in fiscal 2009 and
cash provided by financing activities was $29.6 million in fiscal 2008. The cash flows used in financing activities in fiscal 2010 were primarily for
the repurchase of $381.2 million of treasury shares and $200.0 million in principal of the Company's senior notes. The cash flows used in financing
activities in fiscal 2009 were primarily for the repurchase of $100.0 million in principal amount of the Company's senior notes and the purchase of
$58.4 million of treasury shares. The cash flows provided by financing activities in fiscal 2008 were due to cash received related to the issuance of
shares associated with stock option exercises of $28.9 million 40