GameStop 2010 Annual Report Download - page 52
Download and view the complete annual report
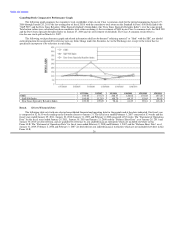
Please find page 52 of the 2010 GameStop annual report below. You can navigate through the pages in the report by either clicking on the pages listed below, or by using the keyword search tool below to find specific information within the annual report.-
 1
1 -
2
-
3
-
4
-
5
-
6
-
7
-
8
-
9
-
10
-
11
-
12
-
13
-
14
-
15
-
16
-
17
-
18
-
19
-
20
-
21
-
22
-
23
-
24
-
25
-
26
-
27
-
28
-
29
-
30
-
31
-
32
-
33
-
34
-
35
-
36
-
37
-
38
-
39
-
40
-
41
-
 42
42 -
 43
43 -
 44
44 -
 45
45 -
 46
46 -
 47
47 -
 48
48 -
 49
49 -
 50
50 -
 51
51 -
 52
52 -
 53
53 -
 54
54 -
 55
55 -
 56
56 -
 57
57 -
 58
58 -
 59
59 -
 60
60 -
 61
61 -
 62
62 -
63
-
64
-
65
-
66
-
67
-
68
-
69
-
70
-
71
-
72
-
73
-
74
-
75
-
76
-
77
-
78
-
79
-
80
-
81
-
82
-
83
-
84
-
85
-
86
-
87
-
88
-
89
-
90
-
91
-
92
-
93
-
94
-
95
-
96
-
97
-
98
-
99
-
100
-
101
-
102
-
103
-
104
-
105
-
106
-
107
-
108
-
109
-
110
-
111
-
112
-
113
-
114
-
115
-
116
-
117
-
118
-
119
-
120
-
121
-
122
-
123
-
124
-
125
-
126
-
127
-
128
-
129
-
130
-
131
-
132
-
133
-
134
-
135
-
136
-
137
-
138
-
139
-
140
-
141
-
142
-
143
 |
 |

Table of Contents
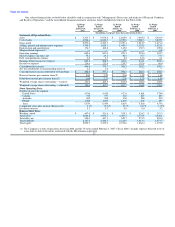
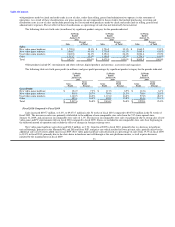
countries in which we operate. Gross profit as a percentage of sales on used video game products decreased from 48.1% in fiscal 2008 to 46.8% in
fiscal 2009 primarily due to increased sales of used products in the international segments as a percentage of total sales. International used product
sales have a lower margin due to the immaturity of the used business model in those segments. Gross profit as a percentage of sales on the other
product sales category increased slightly in fiscal 2009 when compared to fiscal 2008.
Selling, general and administrative expenses increased by $189.7 million, or 13.1%, from $1,445.4 million in fiscal 2008 to $1,635.1 million
in fiscal 2009. The increase was primarily attributable to the full year effect of the acquisition of Micromania in November of fiscal 2008 and the
increase in the number of stores in operation and the related increases in store, distribution and corporate office operating expenses to support the
store growth. Selling, general and administrative expenses as a percentage of sales increased from 16.4% in fiscal 2008 to 18.0% in fiscal 2009. The
increase in selling, general and administrative expenses as a percentage of sales was primarily due to deleveraging of fixed costs as a result of the
decrease in comparable store sales in fiscal 2009. Selling, general and administrative expenses include $37.8 million and $35.4 million in stock-
based compensation expense for fiscal 2009 and fiscal 2008, respectively. Foreign currency transaction gains and (losses) are included in selling,
general and administrative expenses and amounted to $3.8 million in fiscal 2009, compared to ($6.4) million in fiscal 2008.
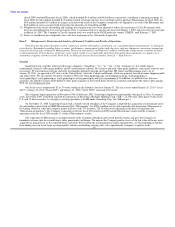
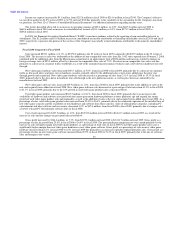
Depreciation and amortization expense increased $17.6 million from $145.0 million in fiscal 2008 to $162.6 million in fiscal 2009. This
increase was primarily due to the acquisition of Micromania, capital expenditures associated with the opening of 388 new stores during fiscal 2009
and investments in management information systems.
Interest income from the investment of excess cash balances decreased from $11.6 million in fiscal 2008 to $2.2 million in fiscal 2009 as a
result of lower invested cash balances due to the prior year acquisitions and lower interest rates. Interest expense decreased from $50.4 million in
fiscal 2008 to $45.4 million in fiscal 2009, primarily due to the retirement of $100.0 million of the Company's senior notes during fiscal 2009 and
the retirement of $30.0 million of the Company's senior notes during fiscal 2008. Debt extinguishment expense of $5.3 million and $2.3 million was
recognized in fiscal 2009 and fiscal 2008, respectively, as a result of the premiums paid related to debt retirement and the recognition of deferred
financing fees and unamortized original issue discount.
Income tax expense decreased by $22.9 million, from $235.7 million in fiscal 2008 to $212.8 million in fiscal 2009. The Company's effective
tax rate decreased from 37.2% in fiscal 2008 to 36.2% in fiscal 2009 due primarily to audit settlements and statute expirations. See Note 12 of
"Notes to Consolidated Financial Statements" for additional information regarding income taxes.
The factors described above led to a decrease in operating earnings of $38.1 million, or 5.6%, from $675.1 million in fiscal 2008 to
$637.0 million in fiscal 2009 and a decrease in consolidated net income of $22.6 million, or 5.7%, from $398.3 million in fiscal 2008 to
$375.7 million in fiscal 2009.
The $1.6 million increase in consolidated net income attributable to GameStop shareholders for fiscal 2009 represents the portion of the net
loss of the Company's non-wholly owned subsidiaries attributable to the minority shareholders' interest.
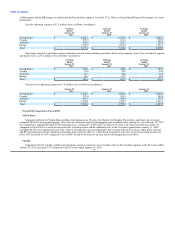
Segment Performance
The Company operates its business in the following segments: United States, Canada, Australia and Europe. We identified these segments
based on a combination of geographic areas, the methods with which we analyze performance and how we divide management responsibility. Each
of the segments consists primarily of retail operations, with all stores engaged in the sale of new and used video game systems, software and
accessories (which we refer to as video game products) and PC entertainment software and related accessories. These products are substantially the
same regardless of geographic location, with the primary differences in merchandise carried being the timing of the release of new products or
technologies in the various segments. Stores in all segments are similar in size at an average of approximately 1,400 square feet.
As we have expanded our presence in international markets, the Company has increased its operations in foreign currencies, including the
euro, Australian dollar, New Zealand dollar, Canadian dollar, British pound, Swiss franc, Danish kroner, Swedish krona, and the Norwegian kroner.
The notes issued in connection with the acquisition 36